

AUD/JPY hovers around 103.70 during the European trading hours on Friday. The Australian Dollar (AUD) continues to experience a decline, driven by recent mixed economic data from China. Any economic change in the Chinese economy could catalyze the Australian market as both nations are close trade partners.
China's Retail Sales (YoY) increased 2.3% in April, down from March's 3.1% and the expected 3.8%. This marks the 15th consecutive month of growth in retail activity but represents the slowest uptick in this trend. Meanwhile, Industrial Production improved 6.7% YoY, surpassing the anticipated 5.5% and the previous recording of 4.5%.
The Aussie Dollar had already been under pressure after Australia's employment figures released on Thursday presented a mixed picture. Australia’s Wage Price Index (QoQ) increased by 0.8% in the first quarter, falling short of the market's forecast of a 0.9% rise. This quarter's increase is the smallest since late 2022. Additionally, annual pay growth slowed slightly to 4.1%, down from the previous 4.2%, and below market expectations.
The Japanese Yen (JPY) encountered renewed pressure as the Bank of Japan (BoJ) maintained its bond-buying amounts on Friday from the previous operation, opting against a surprise cut to debt purchasing earlier in the week. Traders speculate that the BoJ might reduce bond buying at the June policy meeting. BOJ Governor Kazuo Ueda also mentioned that there are no immediate plans to sell the central bank’s ETF holdings.
In an interview with Bloomberg, former BOJ chief economist Toshitaka Sekine suggested that the Bank of Japan could raise its benchmark interest rate up to three more times this year. Sekine proposed that the next move could potentially occur as early as June, given the significant room available to adjust its current "excessively" easy settings.
| Overview | |
|---|---|
| Today last price | 103.73 |
| Today Daily Change | -0.04 |
| Today Daily Change % | -0.04 |
| Today daily open | 103.77 |
| Trends | |
|---|---|
| Daily SMA20 | 101.98 |
| Daily SMA50 | 100.13 |
| Daily SMA100 | 98.74 |
| Daily SMA200 | 97.18 |
| Levels | |
|---|---|
| Previous Daily High | 103.82 |
| Previous Daily Low | 102.8 |
| Previous Weekly High | 103.12 |
| Previous Weekly Low | 100.98 |
| Previous Monthly High | 105.04 |
| Previous Monthly Low | 97.78 |
| Daily Fibonacci 38.2% | 103.43 |
| Daily Fibonacci 61.8% | 103.19 |
| Daily Pivot Point S1 | 103.11 |
| Daily Pivot Point S2 | 102.45 |
| Daily Pivot Point S3 | 102.1 |
| Daily Pivot Point R1 | 104.12 |
| Daily Pivot Point R2 | 104.48 |
| Daily Pivot Point R3 | 105.14 |
Silver prices (XAG/USD) rose on Friday, according to FXStreet data. Silver trades at $29.63 per troy ounce, up 0.18% from the $29.58 it cost on Thursday.
Silver prices have increased by 16.33% since the beginning of the year.
| Unit measure | Today Price |
|---|---|
| Silver price per troy ounce | $29.63 |
| Silver price per gram | $0.95 |
The Gold/Silver ratio, which shows the number of troy ounces of Silver needed to equal the value of one troy ounce of Gold, stood at 80.39 on Friday, up from 80.36 on Thursday.
Investors might use this ratio to determine the relative valuation of Gold and Silver. Some may consider a high ratio as an indicator that Silver is undervalued – or Gold is overvalued – and might buy Silver or sell Gold accordingly. Conversely, a low ratio might suggest that Gold is undervalued relative to Silver.
(An automation tool was used in creating this post.)
Silver is a precious metal highly traded among investors. It has been historically used as a store of value and a medium of exchange. Although less popular than Gold, traders may turn to Silver to diversify their investment portfolio, for its intrinsic value or as a potential hedge during high-inflation periods. Investors can buy physical Silver, in coins or in bars, or trade it through vehicles such as Exchange Traded Funds, which track its price on international markets.
Silver prices can move due to a wide range of factors. Geopolitical instability or fears of a deep recession can make Silver price escalate due to its safe-haven status, although to a lesser extent than Gold's. As a yieldless asset, Silver tends to rise with lower interest rates. Its moves also depend on how the US Dollar (USD) behaves as the asset is priced in dollars (XAG/USD). A strong Dollar tends to keep the price of Silver at bay, whereas a weaker Dollar is likely to propel prices up. Other factors such as investment demand, mining supply – Silver is much more abundant than Gold – and recycling rates can also affect prices.
Silver is widely used in industry, particularly in sectors such as electronics or solar energy, as it has one of the highest electric conductivity of all metals – more than Copper and Gold. A surge in demand can increase prices, while a decline tends to lower them. Dynamics in the US, Chinese and Indian economies can also contribute to price swings: for the US and particularly China, their big industrial sectors use Silver in various processes; in India, consumers’ demand for the precious metal for jewellery also plays a key role in setting prices.
Silver prices tend to follow Gold's moves. When Gold prices rise, Silver typically follows suit, as their status as safe-haven assets is similar. The Gold/Silver ratio, which shows the number of ounces of Silver needed to equal the value of one ounce of Gold, may help to determine the relative valuation between both metals. Some investors may consider a high ratio as an indicator that Silver is undervalued, or Gold is overvalued. On the contrary, a low ratio might suggest that Gold is undervalued relative to Silver.
Gold prices fell in India on Friday, according to data from India's Multi Commodity Exchange (MCX).
Gold price stood at 73,161 Indian Rupees (INR) per 10 grams, down INR 51 compared with the INR 73,212 it cost on Thursday.
As for futures contracts, Gold prices decreased to INR 72,912 per 10 gms from INR 72,980 per 10 gms.
Prices for Silver futures contracts increased to INR 87,575 per kg from INR 87,300 per kg.
| Major Indian city | Gold Price |
|---|---|
| Ahmedabad | 75,730 |
| Mumbai | 75,490 |
| New Delhi | 75,485 |
| Chennai | 75,730 |
| Kolkata | 75,650 |
(An automation tool was used in creating this post.)
Gold has played a key role in human’s history as it has been widely used as a store of value and medium of exchange. Currently, apart from its shine and usage for jewelry, the precious metal is widely seen as a safe-haven asset, meaning that it is considered a good investment during turbulent times. Gold is also widely seen as a hedge against inflation and against depreciating currencies as it doesn’t rely on any specific issuer or government.
Central banks are the biggest Gold holders. In their aim to support their currencies in turbulent times, central banks tend to diversify their reserves and buy Gold to improve the perceived strength of the economy and the currency. High Gold reserves can be a source of trust for a country’s solvency. Central banks added 1,136 tonnes of Gold worth around $70 billion to their reserves in 2022, according to data from the World Gold Council. This is the highest yearly purchase since records began. Central banks from emerging economies such as China, India and Turkey are quickly increasing their Gold reserves.
Gold has an inverse correlation with the US Dollar and US Treasuries, which are both major reserve and safe-haven assets. When the Dollar depreciates, Gold tends to rise, enabling investors and central banks to diversify their assets in turbulent times. Gold is also inversely correlated with risk assets. A rally in the stock market tends to weaken Gold price, while sell-offs in riskier markets tend to favor the precious metal.
The price can move due to a wide range of factors. Geopolitical instability or fears of a deep recession can quickly make Gold price escalate due to its safe-haven status. As a yield-less asset, Gold tends to rise with lower interest rates, while higher cost of money usually weighs down on the yellow metal. Still, most moves depend on how the US Dollar (USD) behaves as the asset is priced in dollars (XAU/USD). A strong Dollar tends to keep the price of Gold controlled, whereas a weaker Dollar is likely to push Gold prices up.
FX option expiries for May 17 NY cut at 10:00 Eastern Time, via DTCC, can be found below
- EUR/USD: EUR amounts
- GBP/USD: GBP amounts
- USD/CHF: USD amounts
- USD/CAD: USD amounts
- USD/JPY: USD amounts
- AUD/USD: AUD amounts
- NZD/USD: NZD amounts
USD/CHF extends its gains for the second day, trading around 0.9080 during the early European hours on Friday. The Swiss Franc (CHF) depreciated against the US Dollar (USD) after the release of the lower Industrial Production released by Swiss Statistics.
The volume of production of Industries in Switzerland declined by 3.1% in the first quarter, following an upwardly revised decline of 0.5% in the previous quarter. This marks the second consecutive quarter of declining industrial activity. On a seasonally adjusted quarterly basis, industrial production dropped by 1% in Q1, compared to an upwardly revised decline of 1.1% in the prior quarter.
On the USD front, the Federal Reserve (Fed) maintains a cautious stance regarding inflation and the potential for rate cuts in 2024, which contributes support for the US Dollar (USD), underpinning the USD/CHF pair.
Reuters reports on Thursday, Atlanta Fed President Raphael Bostic said at an event in Jacksonville that the need for patience with interest rates, noting that substantial pricing pressure persists in the US economy. Additionally, Cleveland Fed President Loretta Mester indicated that it might take longer than anticipated to confidently ascertain the inflation trajectory, suggesting that the Fed should maintain its restrictive stance for an extended period.
However, the higher-than-expected Initial Jobless Claims were released by the US Department of Labor on Thursday. This has contributed to the market expectations of the Federal Reserve’s (Fed) delivering a rate cut in September. The number of Americans filing new claims for jobless benefits rose to 222,000 for the week ending May 10, surpassing the market consensus of 220,000 but below the previous week's figure of 232,000.
| Overview | |
|---|---|
| Today last price | 0.9087 |
| Today Daily Change | 0.0025 |
| Today Daily Change % | 0.28 |
| Today daily open | 0.9062 |
| Trends | |
|---|---|
| Daily SMA20 | 0.9098 |
| Daily SMA50 | 0.9031 |
| Daily SMA100 | 0.8857 |
| Daily SMA200 | 0.8873 |
| Levels | |
|---|---|
| Previous Daily High | 0.9063 |
| Previous Daily Low | 0.8988 |
| Previous Weekly High | 0.9099 |
| Previous Weekly Low | 0.9036 |
| Previous Monthly High | 0.9195 |
| Previous Monthly Low | 0.8998 |
| Daily Fibonacci 38.2% | 0.9034 |
| Daily Fibonacci 61.8% | 0.9017 |
| Daily Pivot Point S1 | 0.9013 |
| Daily Pivot Point S2 | 0.8963 |
| Daily Pivot Point S3 | 0.8938 |
| Daily Pivot Point R1 | 0.9087 |
| Daily Pivot Point R2 | 0.9112 |
| Daily Pivot Point R3 | 0.9162 |
The Pound Sterling (GBP) turns sideways in Friday’s London session after posting a fresh monthly high at 1.2700 on Thursday. The GBP/USD pair struggles to extend upside as investors shift focus to the United Kingdom Consumer Price Index (CPI) data for April, which will be published on Wednesday.
The UK inflation data will provide fresh cues about the interest rate outlook. Investors remain divided between the June and the August meeting about when the Bank of England (BoE) could start reducing interest rates.
April’s inflation data is expected to significantly influence the next move in the Pound Sterling as BoE Governor Andrew Bailey said after the release of the March’s CPI data on April 17, “Inflation in the UK will fall near its 2% target next month” and has declined roughly in step with the BOE’s forecast in February. Bailey added, “I expect that next month's number will show quite a strong drop because we have a particularly unique energy to household energy pricing system in the UK,” Bloomberg reported.

The Pound Sterling advances to the 61.8% Fibonacci retracement (plotted from the March high at around 1.2900 to the April low at 1.2300) at 1.2670 on a daily timeframe. The GBP/USD pair could extend its upside after a decisive break above the round-level resistance of 1.2700.
On the downside, 50-day and 200-day Exponential Moving Averages (EMAs), which trade around 1.2565 and 1.2536, respectively, will be the major support zones for the Pound Sterling
The 14-period Relative Strength Index (RSI) has shifted into the bullish range of 60.00-80.00, suggesting that the momentum has leaned toward the upside.
The Pound Sterling (GBP) is the oldest currency in the world (886 AD) and the official currency of the United Kingdom. It is the fourth most traded unit for foreign exchange (FX) in the world, accounting for 12% of all transactions, averaging $630 billion a day, according to 2022 data. Its key trading pairs are GBP/USD, aka ‘Cable’, which accounts for 11% of FX, GBP/JPY, or the ‘Dragon’ as it is known by traders (3%), and EUR/GBP (2%). The Pound Sterling is issued by the Bank of England (BoE).
The single most important factor influencing the value of the Pound Sterling is monetary policy decided by the Bank of England. The BoE bases its decisions on whether it has achieved its primary goal of “price stability” – a steady inflation rate of around 2%. Its primary tool for achieving this is the adjustment of interest rates. When inflation is too high, the BoE will try to rein it in by raising interest rates, making it more expensive for people and businesses to access credit. This is generally positive for GBP, as higher interest rates make the UK a more attractive place for global investors to park their money. When inflation falls too low it is a sign economic growth is slowing. In this scenario, the BoE will consider lowering interest rates to cheapen credit so businesses will borrow more to invest in growth-generating projects.
Data releases gauge the health of the economy and can impact the value of the Pound Sterling. Indicators such as GDP, Manufacturing and Services PMIs, and employment can all influence the direction of the GBP. A strong economy is good for Sterling. Not only does it attract more foreign investment but it may encourage the BoE to put up interest rates, which will directly strengthen GBP. Otherwise, if economic data is weak, the Pound Sterling is likely to fall.
Another significant data release for the Pound Sterling is the Trade Balance. This indicator measures the difference between what a country earns from its exports and what it spends on imports over a given period. If a country produces highly sought-after exports, its currency will benefit purely from the extra demand created from foreign buyers seeking to purchase these goods. Therefore, a positive net Trade Balance strengthens a currency and vice versa for a negative balance.
The Mexican Peso (MXN) trades broadly unchanged in its key pairs on Friday, with USD/MXN flatlining as the US Dollar (USD) stabilizes after its recent sell-off and market sentiment remains relatively calm heading into the weekend.
At the time of writing, USD/MXN is trading at 16.70, EUR/MXN at 18.14 and GBP/MXN at 21.15.
The Mexican Peso holds the line in its major pairs as a lack of market moving data and geopolitical shocks keeps volatility to a minimum.
On Thursday the US released a mixed bag of data that did not really change the outlook for the economy or interest rates, a key driver for FX. The same went for Europe and the UK.
Regarding the US data, the results were as follows:
Apart from the data, several US Federal Reserve (Fed) officials commented on Fed monetary policy, but their words were interpreted as neutral and had little impact.
The President of the Richmond Fed Thomas Barkin said inflation is coming down, but that it will “take more time” to hit the Fed’s target.
Cleveland Fed President Loretta Mester, meanwhile, welcomed the latest CPI data but said monetary policy is well-positioned.
Atlanta Fed President Raphael Bostic said he was pleased with the progress on inflation in April but that the Fed needed to “be patient and vigilant.”
In Europe, European Central Bank (ECB) executive board member Isabel Schnabel, meanwhile, said an interest rate cut in June may be appropriate but the “path beyond June is much more uncertain.”
So, to sum up, no big changes there and business as usual.
USD/MXN – the value of one US Dollar in Mexican Pesos – trades sideways after the massive sell-off on Wednesday.
The consolidation after the steep decline could possibly be the early beginnings of a Bear Flag continuation pattern, although it is still early to say for sure.
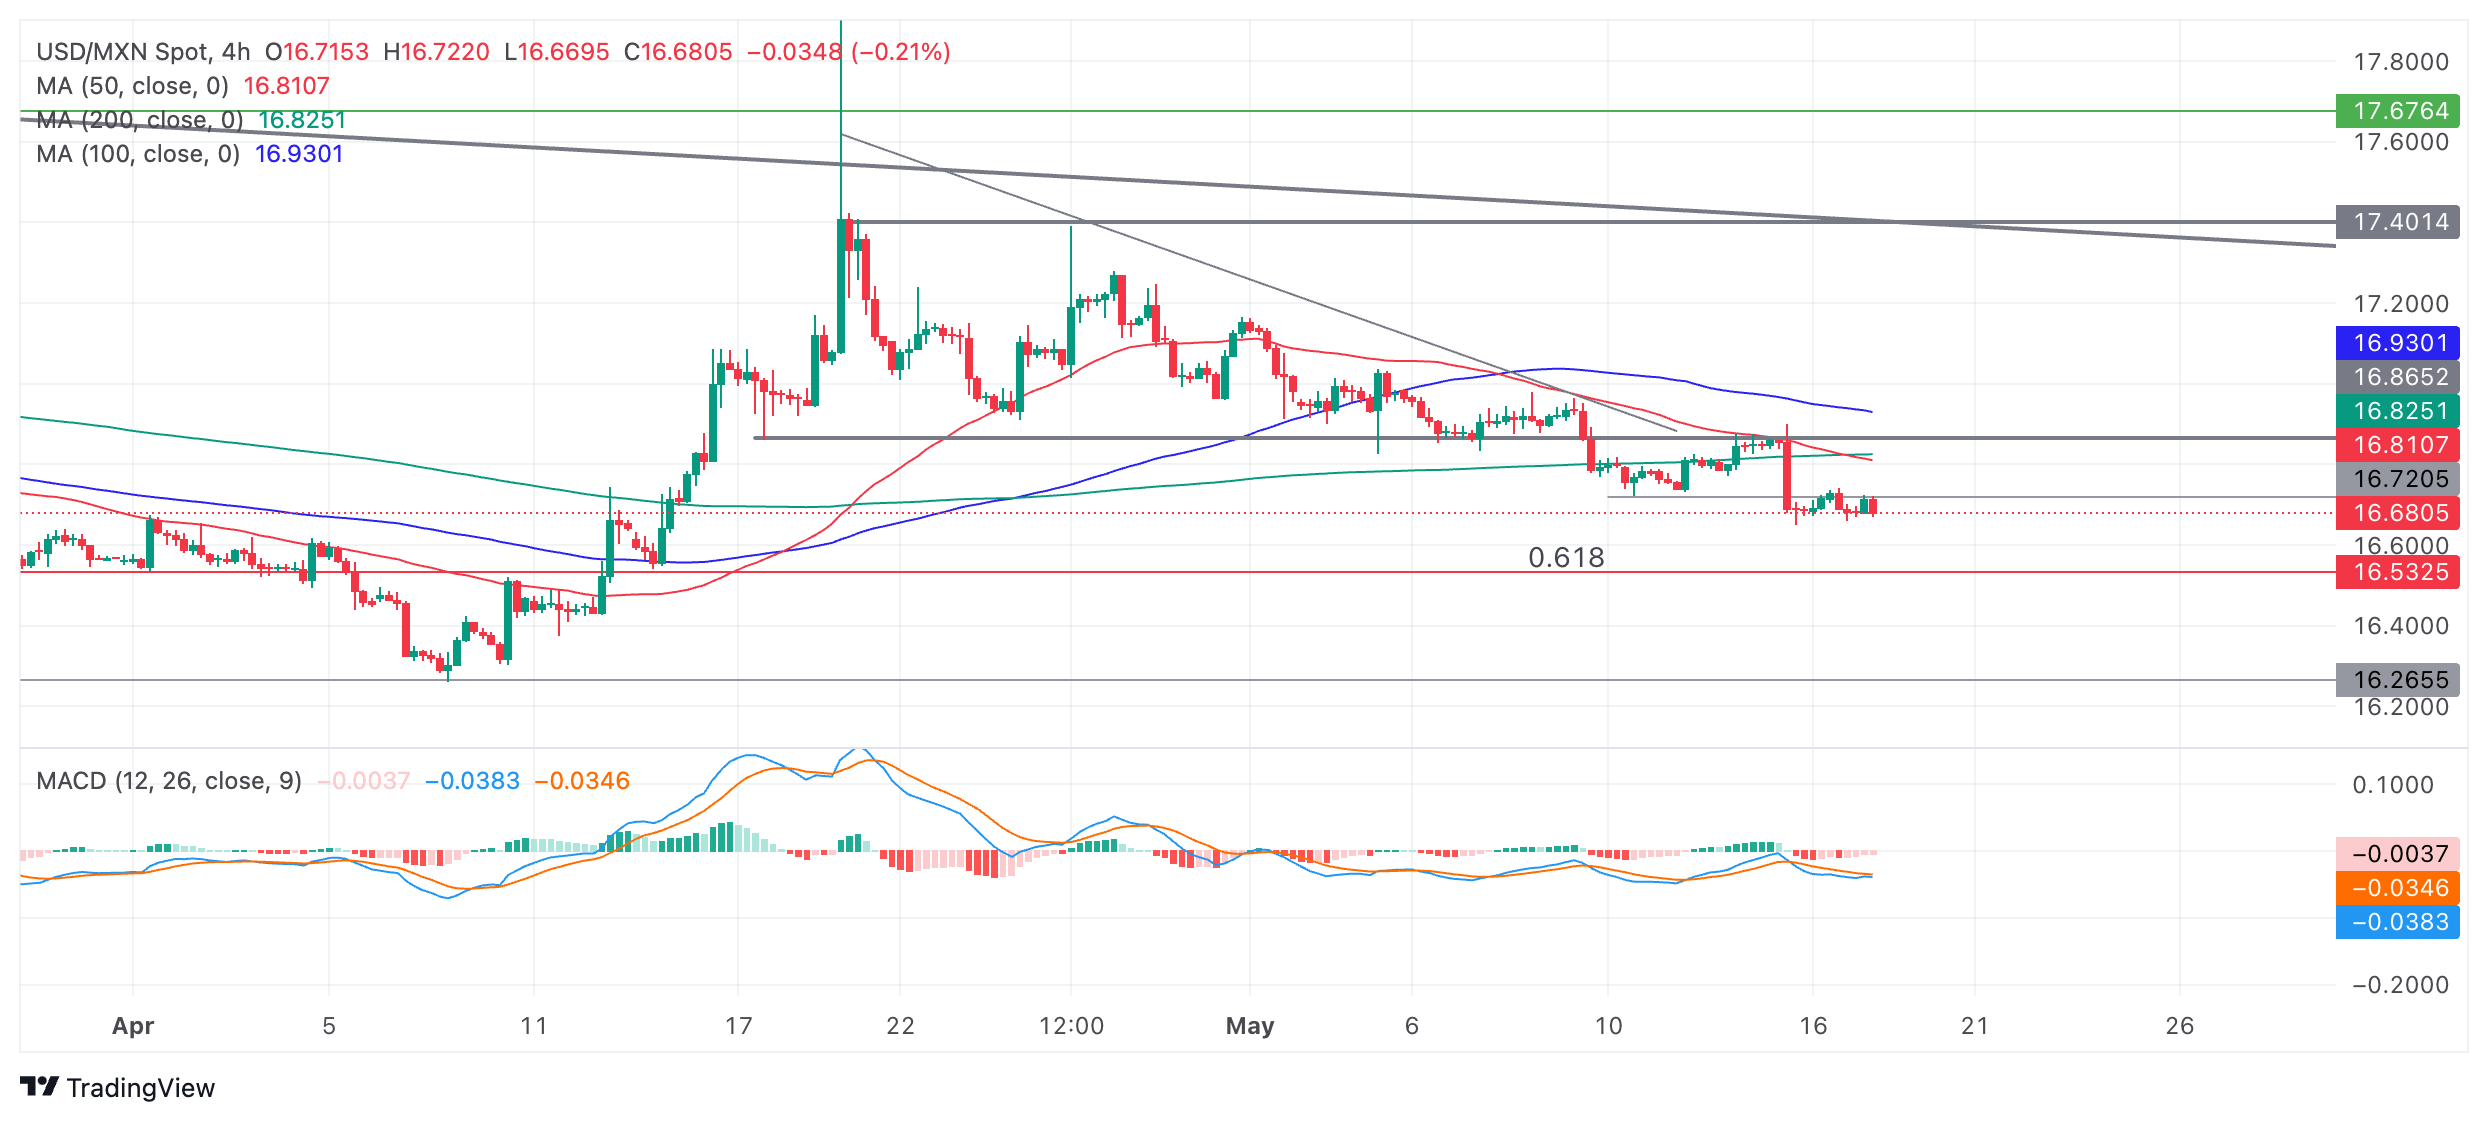
Ever since breaking out below the bottom of its range at 16.86 on May 9, the pair has looked like it has been in a short-term downtrend, favoring shorts over longs.
If USD/MXN breaks below the May 15 lows of 16.64, it will probably confirm the start of the next leg lower.
More downside would likely reach the conservative target for the breakout of the mid-April to May range at 16.54, which is the 0.618 Fibonacci ratio of the height of the range extrapolated lower. Further bearishness could even reach 16.34, the full height of the range extrapolated lower.
Given the medium and long-term trends are bearish, the odds further favor more downside.
It would take a recovery and decisive break back inside the range (above 16.86) to reverse the downtrending bias.
A decisive break would be one accompanied by a longer-than-average green candlestick that closed near its high or three green candlesticks in a row.
The Building Permits released by the US Census Bureau, at the Department of Commerce shows the number of permits for new construction projects. It implies the movement of corporate investments (US economic development). It tends to cause some volatility to the USD. Normally, the more growing number of permits, the more positive (or bullish) for the USD.
Read more.Last release: Thu May 16, 2024 12:30
Frequency: Monthly
Actual: 1.44M
Consensus: 1.48M
Previous: 1.458M
Source: US Census Bureau
Here is what you need to know on Friday, May 17:
Following the sharp decline seen after April inflation data on Wednesday, the US Dollar Index managed to stage a modest rebound on Thursday and closed the day in positive territory. On Friday, Eurostat will release revisions to April Harmonized Index of Consumer Prices (HICP) data. Later in the day, investors will remain focused on comments from Federal Reserve (Fed) officials in the absence of high-impact data releases from the US.
The data published by the US Department of Labor showed on Thursday that there were 222,000 first-time applications for unemployment benefits in the week ending May 11, down from 232,000 in the previous week. In the meantime, several Fed officials spoke on Thursday and called for patience with regards to lowering the policy rate, while acknowledging the progress seen in inflation in April Consumer Price Index (CPI) data. After falling more than 2% on Wednesday, the benchmark 10-yaer US Treasury bond yield gains 0.7% on Thursday and closed the day in the green, helping the US Dollar stay resilient against its rivals. Early Friday, the 10-year US yield stays flat slightly below 4.4% and US stock index futures trade virtually unchanged.
The table below shows the percentage change of US Dollar (USD) against listed major currencies this week. US Dollar was the weakest against the New Zealand Dollar.
| USD | EUR | GBP | JPY | CAD | AUD | NZD | CHF | |
|---|---|---|---|---|---|---|---|---|
| USD | -0.84% | -1.09% | -0.05% | -0.34% | -0.99% | -1.54% | 0.07% | |
| EUR | 0.84% | -0.31% | 0.78% | 0.48% | -0.19% | -0.74% | 0.90% | |
| GBP | 1.09% | 0.31% | 1.03% | 0.78% | 0.12% | -0.43% | 1.21% | |
| JPY | 0.05% | -0.78% | -1.03% | -0.31% | -0.91% | -1.55% | 0.16% | |
| CAD | 0.34% | -0.48% | -0.78% | 0.31% | -0.63% | -1.22% | 0.33% | |
| AUD | 0.99% | 0.19% | -0.12% | 0.91% | 0.63% | -0.65% | 1.08% | |
| NZD | 1.54% | 0.74% | 0.43% | 1.55% | 1.22% | 0.65% | 1.64% | |
| CHF | -0.07% | -0.90% | -1.21% | -0.16% | -0.33% | -1.08% | -1.64% |
The heat map shows percentage changes of major currencies against each other. The base currency is picked from the left column, while the quote currency is picked from the top row. For example, if you pick the US Dollar from the left column and move along the horizontal line to the Japanese Yen, the percentage change displayed in the box will represent USD (base)/JPY (quote).
Fed officials stick to cautious tones, but outlook beginning to tease rate cuts.
During the Asian trading hours, the data from China showed that Retail Sales rose 2.3% on a yearly basis in April, missing the market expectation for an increase of 3.8%. On a positive note, Industrial Production expanded 6.7% in the same period and beat analysts' estimate of 5.5%. After closing in the red on Thursday, AUD/USD continued to edge lower and was last seen losing 0.2% on the day at 0.6665.
Australian Dollar struggles as Aussie 10-year yield drops to a monthly low.
Following Wednesday's impressive upsurge, EUR/USD corrected lower on Thursday. The pair stays relatively quiet and fluctuates slightly above 1.0850 in the European morning on Friday.
GBP/USD turned south after testing 1.2700 early Thursday and registered modest daily losses. The pair continues to edge lower toward 1.2650 early European session.
USD/JPY stretches higher on Friday and trades above 155.50 after closing in positive territory on Thursday.
Gold struggled to build on Wednesday gains and posted small losses on Thursday, pressured by recovering US Treasury bond yields. XAU/USD, however, managed to find a foothold early Friday and was last seen gaining 0.4% on the day at $2,386.
Gold price loses traction, with Fed speakers in focus.
Monetary policy in the US is shaped by the Federal Reserve (Fed). The Fed has two mandates: to achieve price stability and foster full employment. Its primary tool to achieve these goals is by adjusting interest rates. When prices are rising too quickly and inflation is above the Fed’s 2% target, it raises interest rates, increasing borrowing costs throughout the economy. This results in a stronger US Dollar (USD) as it makes the US a more attractive place for international investors to park their money. When inflation falls below 2% or the Unemployment Rate is too high, the Fed may lower interest rates to encourage borrowing, which weighs on the Greenback.
The Federal Reserve (Fed) holds eight policy meetings a year, where the Federal Open Market Committee (FOMC) assesses economic conditions and makes monetary policy decisions. The FOMC is attended by twelve Fed officials – the seven members of the Board of Governors, the president of the Federal Reserve Bank of New York, and four of the remaining eleven regional Reserve Bank presidents, who serve one-year terms on a rotating basis.
In extreme situations, the Federal Reserve may resort to a policy named Quantitative Easing (QE). QE is the process by which the Fed substantially increases the flow of credit in a stuck financial system. It is a non-standard policy measure used during crises or when inflation is extremely low. It was the Fed’s weapon of choice during the Great Financial Crisis in 2008. It involves the Fed printing more Dollars and using them to buy high grade bonds from financial institutions. QE usually weakens the US Dollar.
Quantitative tightening (QT) is the reverse process of QE, whereby the Federal Reserve stops buying bonds from financial institutions and does not reinvest the principal from the bonds it holds maturing, to purchase new bonds. It is usually positive for the value of the US Dollar.
The EUR/JPY cross extends the rally around 169.20 during the early European trading hours on Friday. The Japanese Yen (JPY) has weakened as Japan's economy contracted more than expected in the first quarter (Q1) of 2024, challenging the Bank of Japan's (BoJ) push to get interest rates further away from near zero. On Friday, the BoJ left the amount of bonds it buys at regular operations unchanged, adding to a modest dip in the JPY after helping the currency earlier in the week with a surprise reduction in purchases, per Bloomberg.
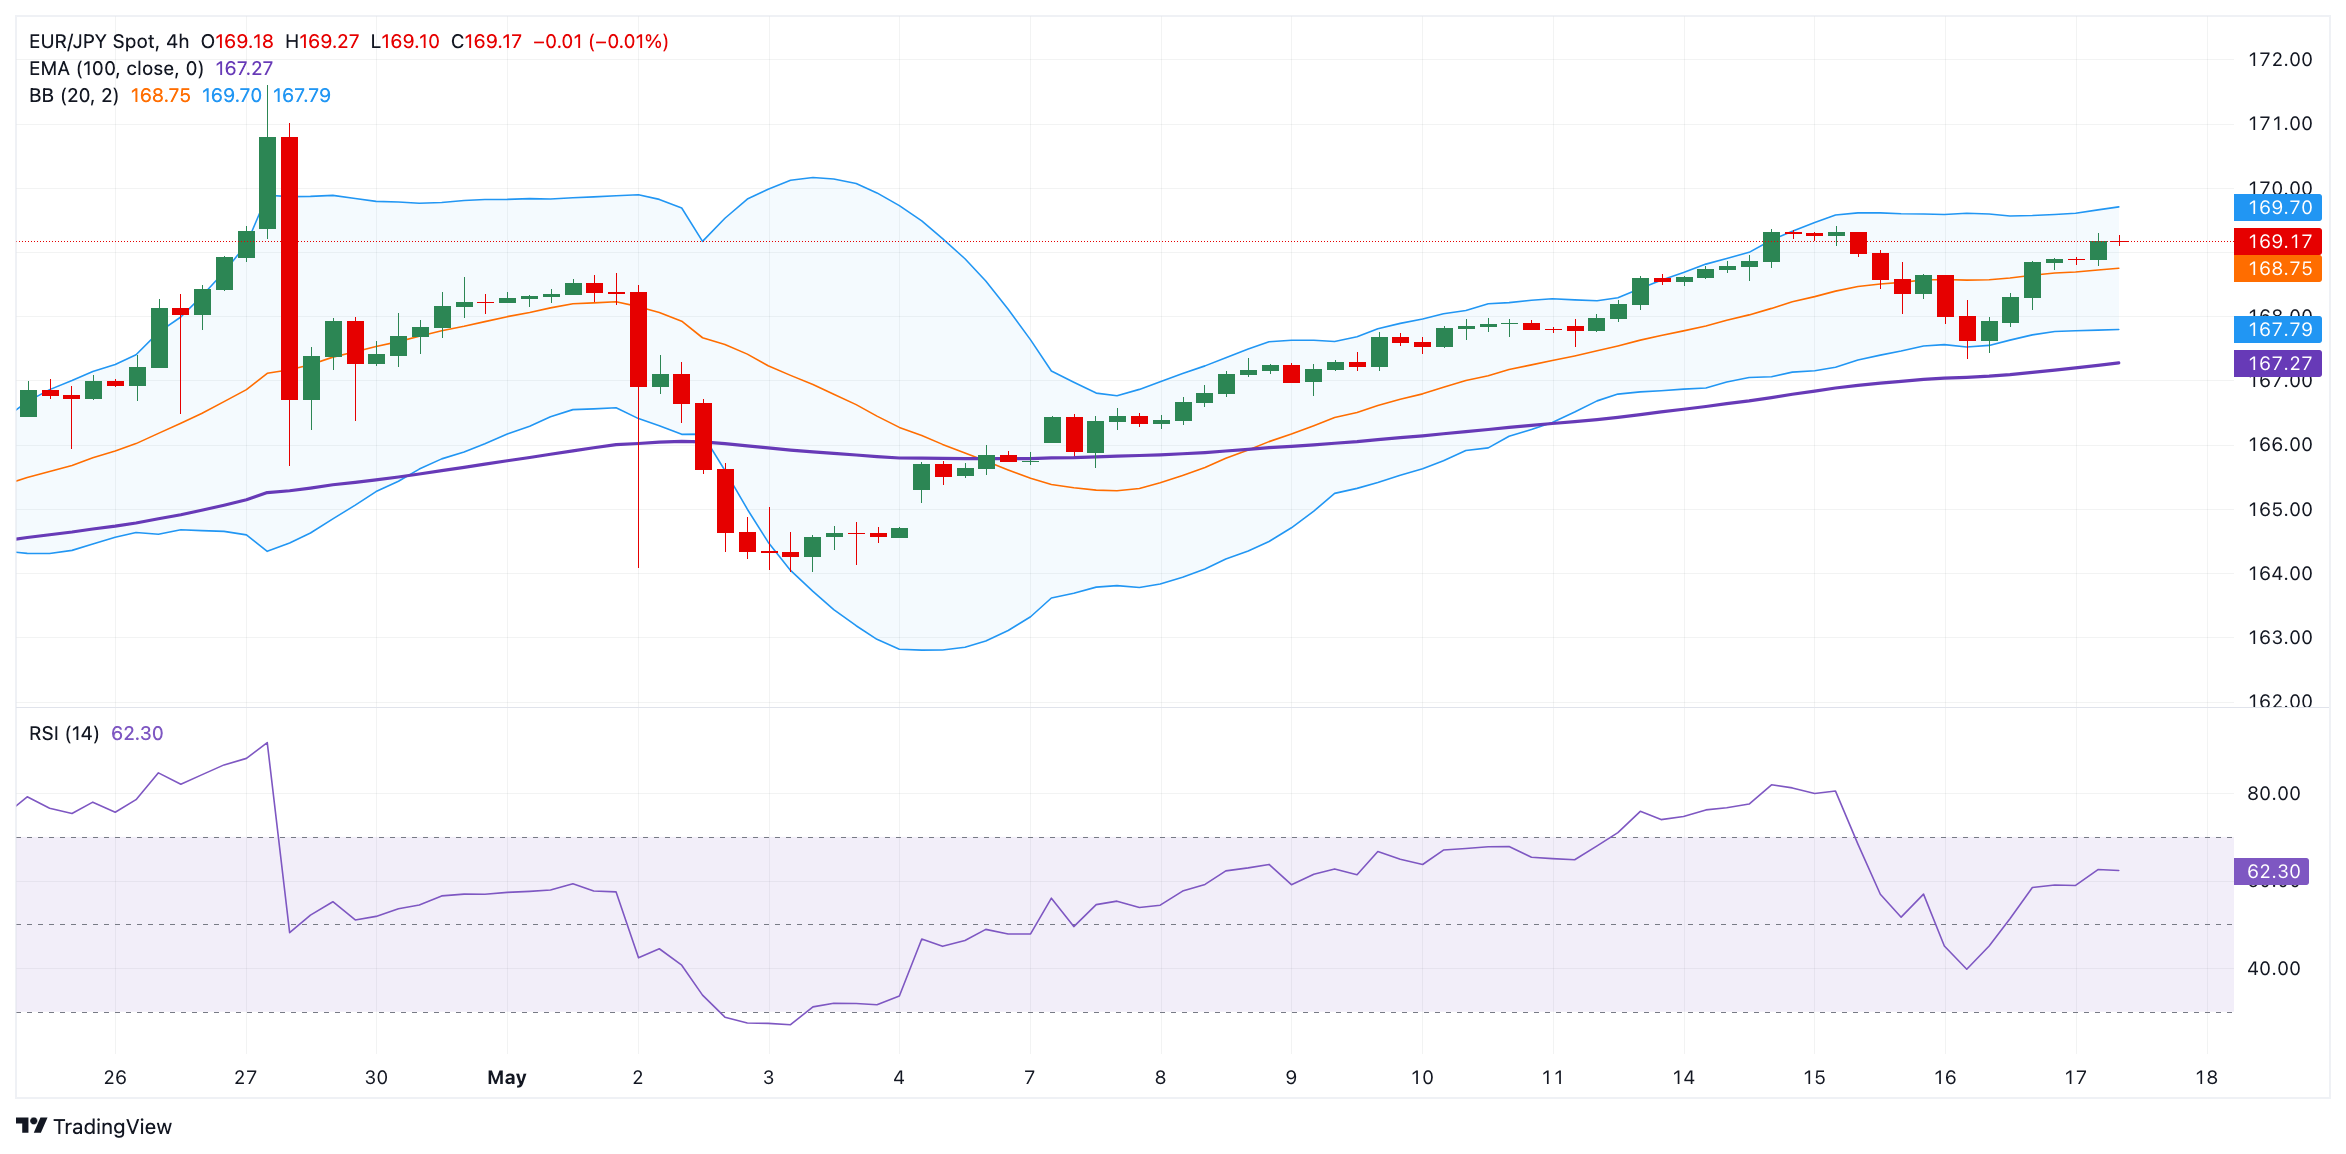
Technically, EUR/JPY maintains the bullish outlook unchanged as the cross holds above the 100-period Exponential Moving Averages (EMA) on the four-hour chart. The upward momentum is backed by the Relative Strength Index (RSI), which stands in bullish territory near 62.60, supporting the buyers for the time being.
The immediate resistance level for the cross will emerge near a high of May 15 at 169.40. The additional upside filter to watch is the 170.00 psychological round figure. A decisive break above the latter will see a rally to the next barrier around a high of April 29 at 171.60.
On the flip side, the first downside target is seen at the 100-period EMA at 167.80. Further south, the next contention level is located near a low of May 16 at 167.33, followed by a low of April 29 at 165.66.
| Overview | |
|---|---|
| Today last price | 169.27 |
| Today Daily Change | 0.41 |
| Today Daily Change % | 0.24 |
| Today daily open | 168.86 |
| Trends | |
|---|---|
| Daily SMA20 | 166.95 |
| Daily SMA50 | 164.87 |
| Daily SMA100 | 162.68 |
| Daily SMA200 | 160.71 |
| Levels | |
|---|---|
| Previous Daily High | 168.91 |
| Previous Daily Low | 167.33 |
| Previous Weekly High | 167.97 |
| Previous Weekly Low | 164.48 |
| Previous Monthly High | 171.6 |
| Previous Monthly Low | 162.28 |
| Daily Fibonacci 38.2% | 168.31 |
| Daily Fibonacci 61.8% | 167.93 |
| Daily Pivot Point S1 | 167.82 |
| Daily Pivot Point S2 | 166.79 |
| Daily Pivot Point S3 | 166.24 |
| Daily Pivot Point R1 | 169.4 |
| Daily Pivot Point R2 | 169.95 |
| Daily Pivot Point R3 | 170.98 |
Silver price retraces its recent losses registered on Thursday, trading around $29.70 per troy ounce during the Asian hours on Friday. The price of the grey metal as investors turn cautious following the higher-than-expected Initial Jobless Claims released by the US Department of Labor on Thursday. This has contributed to the dovish expectations of the Federal Reserve’s (Fed) delivering a rate cut in September.
The number of Americans filing new claims for jobless benefits rose to 222,000 for the week ending May 10, surpassing the market consensus of 220,000 but below the previous week's figure of 232,000.
On Thursday, Fed Bank of Atlanta President Raphael Bostic emphasized the need for patience with interest rates, noting that substantial pricing pressure persists in the US economy. Additionally, Cleveland Fed President Loretta Mester indicated that it might take longer than anticipated to confidently ascertain the inflation trajectory, suggesting that the Fed should maintain its restrictive stance for an extended period.
Reuters reports on Thursday, Atlanta Fed President Raphael Bostic said at an event in Jacksonville that the need for patience with interest rates, noting that substantial pricing pressure persists in the US economy. Additionally, Cleveland Fed President Loretta Mester indicated that it might take longer than anticipated to confidently ascertain the inflation trajectory, suggesting that the Fed should maintain its restrictive stance for an extended period.
In the absence of top-tier economic data from the US docket, market participants will likely observe Fedspeak for insights into the future direction of the Fed's monetary policy. Later on Friday, Minneapolis Fed President Neel Kashkari and San Francisco Fed President Mary Daly are scheduled to speak, potentially providing valuable hints.
| Overview | |
|---|---|
| Today last price | 29.7 |
| Today Daily Change | 0.12 |
| Today Daily Change % | 0.41 |
| Today daily open | 29.58 |
| Trends | |
|---|---|
| Daily SMA20 | 27.64 |
| Daily SMA50 | 26.71 |
| Daily SMA100 | 24.82 |
| Daily SMA200 | 24.04 |
| Levels | |
|---|---|
| Previous Daily High | 29.85 |
| Previous Daily Low | 29.33 |
| Previous Weekly High | 28.77 |
| Previous Weekly Low | 26.44 |
| Previous Monthly High | 29.8 |
| Previous Monthly Low | 24.75 |
| Daily Fibonacci 38.2% | 29.53 |
| Daily Fibonacci 61.8% | 29.65 |
| Daily Pivot Point S1 | 29.32 |
| Daily Pivot Point S2 | 29.07 |
| Daily Pivot Point S3 | 28.81 |
| Daily Pivot Point R1 | 29.84 |
| Daily Pivot Point R2 | 30.1 |
| Daily Pivot Point R3 | 30.35 |
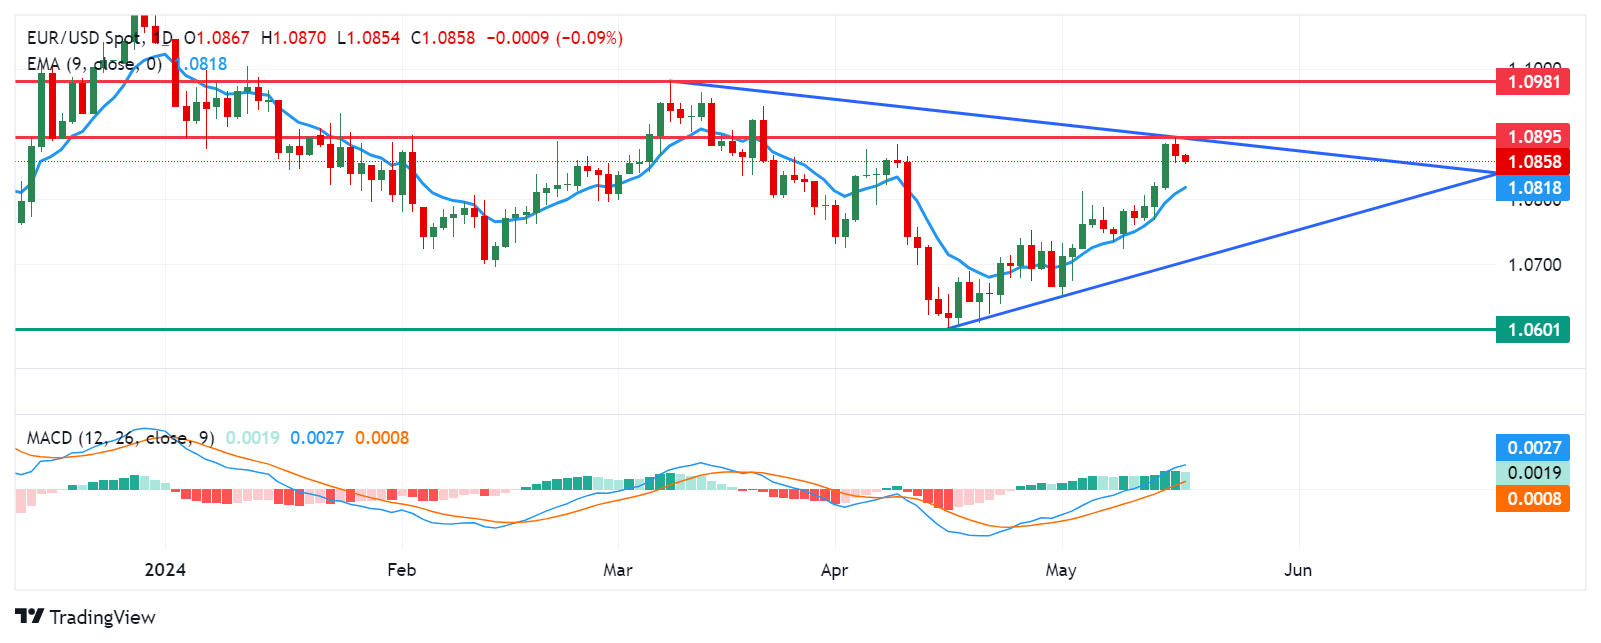
EUR/USD continues to lose ground, trading around 1.0860 during the Asian hours on Friday. From a technical perspective on a daily chart, analysis indicates a sideways trend for the pair as it continues to lie within the symmetrical triangle. A surpassing of the upper boundary could shift the momentum toward a bullish bias.
However, the momentum indicator Moving Average Convergence Divergence (MACD) suggests a bullish sentiment for the EUR/USD pair. Positioned above the centerline, there's a noted divergence above the signal line, indicating upward momentum.
The EUR/USD pair could challenge the key barrier at the upper boundary of the symmetrical triangle aligned with the psychological level of 1.0900. A break above this level could support the pair to test the pullback resistance at 1.0981.
Conversely, downside potential for the EUR/USD pair suggests initial support near the significant level of 1.0850, with further support expected around the nine-day Exponential Moving Average (EMA) at 1.0818. A breach below the latter could prompt movement toward the lower boundary of the symmetrical triangle, aligning with the psychological threshold of 1.0700. Additional support levels might come into play around April’s low at 1.0601.
| Overview | |
|---|---|
| Today last price | 1.0858 |
| Today Daily Change | -0.0009 |
| Today Daily Change % | -0.08 |
| Today daily open | 1.0867 |
| Trends | |
|---|---|
| Daily SMA20 | 1.0745 |
| Daily SMA50 | 1.0785 |
| Daily SMA100 | 1.0821 |
| Daily SMA200 | 1.079 |
| Levels | |
|---|---|
| Previous Daily High | 1.0895 |
| Previous Daily Low | 1.0854 |
| Previous Weekly High | 1.0791 |
| Previous Weekly Low | 1.0724 |
| Previous Monthly High | 1.0885 |
| Previous Monthly Low | 1.0601 |
| Daily Fibonacci 38.2% | 1.087 |
| Daily Fibonacci 61.8% | 1.088 |
| Daily Pivot Point S1 | 1.0849 |
| Daily Pivot Point S2 | 1.0832 |
| Daily Pivot Point S3 | 1.0809 |
| Daily Pivot Point R1 | 1.089 |
| Daily Pivot Point R2 | 1.0913 |
| Daily Pivot Point R3 | 1.093 |
USD/JPY rose to near 155.90 during the Asian session on Friday as the Japanese Yen (JPY) encountered renewed pressure. This was sparked by the Bank of Japan (BoJ) maintaining its bond-buying amounts from the previous operation, opting against a surprise cut to debt purchasing earlier in the week.
Traders speculate that the BoJ might reduce bond buying at the June policy meeting. BOJ Governor Kazuo Ueda also mentioned that there are no immediate plans to sell the central bank’s ETF holdings.
In an interview with Bloomberg, former BOJ chief economist Toshitaka Sekine suggested that the Bank of Japan could raise its benchmark interest rate up to three more times this year. Sekine indicated that the next move could potentially occur as early as June, given the significant room available to adjust its current "excessively" easy settings.
The US Dollar Index (DXY), which gauges the performance of the US Dollar (USD) against six major currencies, trades around 104.60 after rebounding from a multi-week low of 104.08 marked on Thursday. The Federal Reserve (Fed) maintains a cautious stance regarding inflation and the potential for rate cuts in 2024.
Reuters reports on Thursday, Atlanta Fed President Raphael Bostic said at an event in Jacksonville that the need for patience with interest rates, noting that substantial pricing pressure persists in the US economy. Additionally, Cleveland Fed President Loretta Mester indicated that it might take longer than anticipated to confidently ascertain the inflation trajectory, suggesting that the Fed should maintain its restrictive stance for an extended period.
| Overview | |
|---|---|
| Today last price | 155.76 |
| Today Daily Change | 0.37 |
| Today Daily Change % | 0.24 |
| Today daily open | 155.39 |
| Trends | |
|---|---|
| Daily SMA20 | 155.37 |
| Daily SMA50 | 152.9 |
| Daily SMA100 | 150.36 |
| Daily SMA200 | 148.98 |
| Levels | |
|---|---|
| Previous Daily High | 155.54 |
| Previous Daily Low | 153.6 |
| Previous Weekly High | 155.95 |
| Previous Weekly Low | 152.8 |
| Previous Monthly High | 160.32 |
| Previous Monthly Low | 150.81 |
| Daily Fibonacci 38.2% | 154.8 |
| Daily Fibonacci 61.8% | 154.34 |
| Daily Pivot Point S1 | 154.15 |
| Daily Pivot Point S2 | 152.91 |
| Daily Pivot Point S3 | 152.21 |
| Daily Pivot Point R1 | 156.08 |
| Daily Pivot Point R2 | 156.78 |
| Daily Pivot Point R3 | 158.02 |
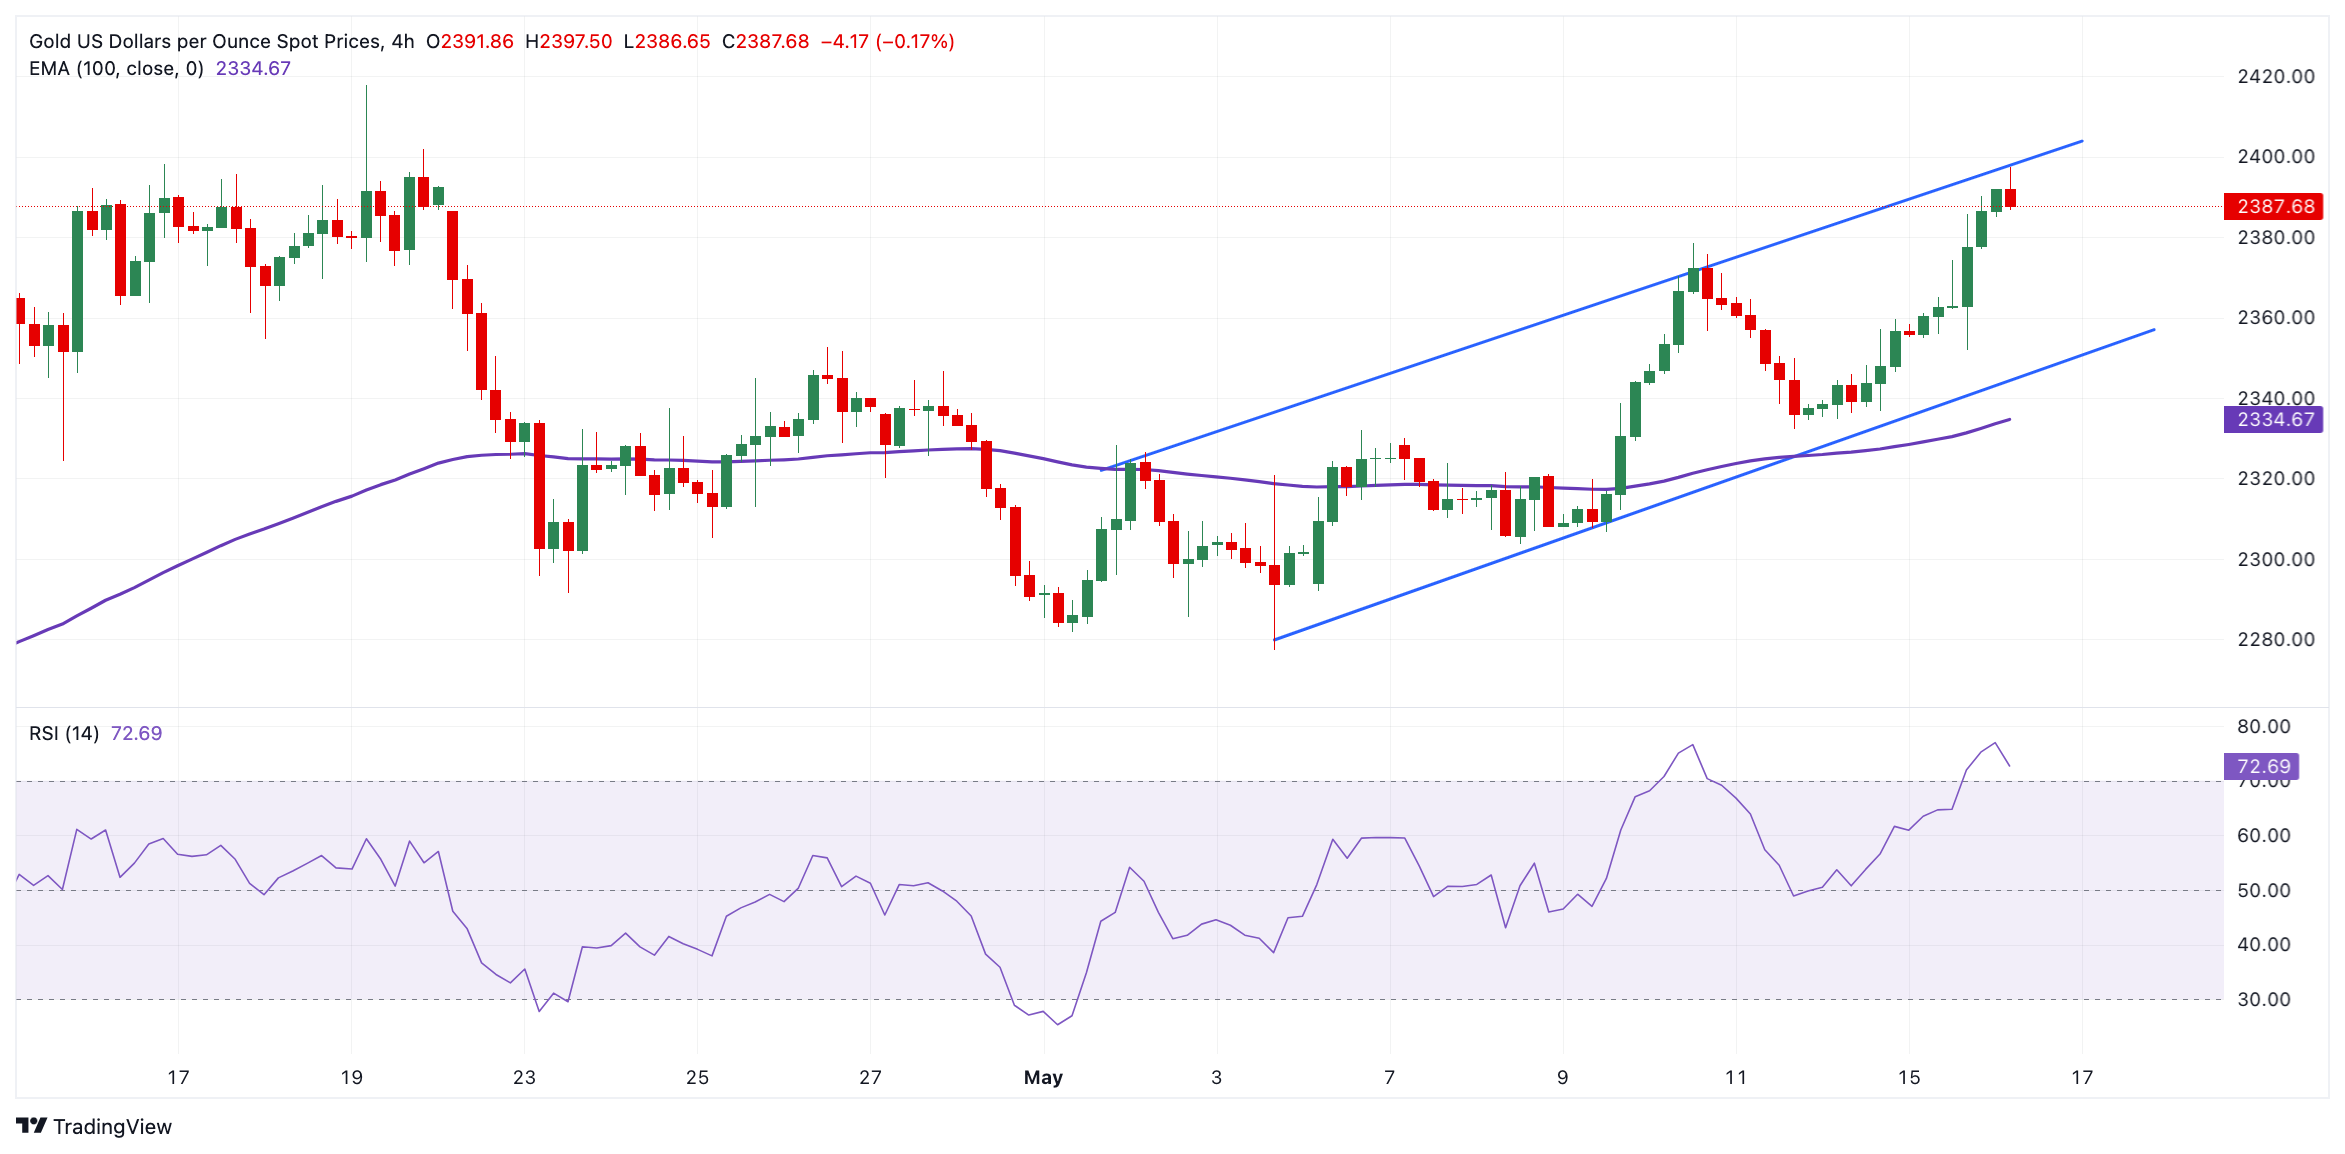
The gold price (XAU/USD) trades with a bearish bias on Friday after retreating from the nearly $2,400 barrier. The bullish move of precious metals in the previous sessions was bolstered by the softer-than-expected US inflation data in April, which triggered hope for rate cuts from the US Federal Reserve (Fed). However, the cautious approach from Fed officials on Thursday to keep borrowing costs high for longer suggested that the US central bank is not in a rush to cut interest rates this year. This, in turn, boosts the US Dollar (USD) broadly and drags the yellow metal lower, as higher interest rates might well reduce overall investment demand for non-yielding gold.
In the absence of top-tier economic data from the US docket, market participants will monitor Fedspeak, which might offer some hints about the future path of the Fed’s monetary policy. The Fed’s Kashkari, Waller, and Daly are set to speak later on Friday.
The gold price trades on a negative note on the day. According to the four-hour chart, the precious metal has formed an ascending trend channel since May 2. The constructive outlook of gold remains intact, as it is above the 100-period Exponential Moving Average (EMA). The path of least resistance level is to the upside, as XAU/USD stands in bullish territory around 62.00.
The upper boundary of the ascending trend channel and psychological barrier of $2,400 act as a crucial resistance level for the yellow metal for the time being. With a break above this level, gold could make another attempt at an all-time high of $2,432 en route to the $2,500 round figure.
In the bearish case, the first downside filter to watch is the lower limit of the ascending trend channel of $2,355. Further south, the next contention level is seen at the 100-period EMA at $2,340. Any follow-through selling below the mentioned level might drag XAU/USD back to $2,300.
The table below shows the percentage change of US Dollar (USD) against listed major currencies today. US Dollar was the strongest against the Japanese Yen.
| USD | EUR | GBP | CAD | AUD | JPY | NZD | CHF | |
| USD | 0.07% | 0.11% | 0.08% | 0.25% | 0.31% | 0.19% | 0.11% | |
| EUR | -0.07% | 0.04% | 0.00% | 0.18% | 0.24% | 0.13% | 0.04% | |
| GBP | -0.11% | -0.04% | -0.04% | 0.14% | 0.19% | 0.07% | -0.01% | |
| CAD | -0.08% | -0.01% | 0.04% | 0.17% | 0.23% | 0.12% | 0.03% | |
| AUD | -0.26% | -0.18% | -0.13% | -0.17% | 0.06% | -0.06% | -0.14% | |
| JPY | -0.32% | -0.24% | -0.20% | -0.23% | -0.07% | -0.11% | -0.19% | |
| NZD | -0.20% | -0.13% | -0.09% | -0.13% | 0.05% | 0.10% | -0.10% | |
| CHF | -0.11% | -0.03% | 0.01% | -0.03% | 0.15% | 0.20% | 0.10% |
The heat map shows percentage changes of major currencies against each other. The base currency is picked from the left column, while the quote currency is picked from the top row. For example, if you pick the Euro from the left column and move along the horizontal line to the Japanese Yen, the percentage change displayed in the box will represent EUR (base)/JPY (quote).
Gold has played a key role in human’s history as it has been widely used as a store of value and medium of exchange. Currently, apart from its shine and usage for jewelry, the precious metal is widely seen as a safe-haven asset, meaning that it is considered a good investment during turbulent times. Gold is also widely seen as a hedge against inflation and against depreciating currencies as it doesn’t rely on any specific issuer or government.
Central banks are the biggest Gold holders. In their aim to support their currencies in turbulent times, central banks tend to diversify their reserves and buy Gold to improve the perceived strength of the economy and the currency. High Gold reserves can be a source of trust for a country’s solvency. Central banks added 1,136 tonnes of Gold worth around $70 billion to their reserves in 2022, according to data from the World Gold Council. This is the highest yearly purchase since records began. Central banks from emerging economies such as China, India and Turkey are quickly increasing their Gold reserves.
Gold has an inverse correlation with the US Dollar and US Treasuries, which are both major reserve and safe-haven assets. When the Dollar depreciates, Gold tends to rise, enabling investors and central banks to diversify their assets in turbulent times. Gold is also inversely correlated with risk assets. A rally in the stock market tends to weaken Gold price, while sell-offs in riskier markets tend to favor the precious metal.
The price can move due to a wide range of factors. Geopolitical instability or fears of a deep recession can quickly make Gold price escalate due to its safe-haven status. As a yield-less asset, Gold tends to rise with lower interest rates, while higher cost of money usually weighs down on the yellow metal. Still, most moves depend on how the US Dollar (USD) behaves as the asset is priced in dollars (XAU/USD). A strong Dollar tends to keep the price of Gold controlled, whereas a weaker Dollar is likely to push Gold prices up.
European Central Bank (ECB) Board member Isabel Schnabel said on Friday that the central bank may cut interest rates in June, but policymakers should look very carefully at the data because there is a risk of easing prematurely, per Reuters.
“Says depending on incoming data rate cut in June may be appropriate but a path beyond June is much more uncertain.”
“Recent data have confirmed that the last mile of disinflation is most difficult.”
“Based on current data, a rate cut in July does not seem warranted.”
“With inflation risks still being tilted to the upside, front-loading of easing process would come with a risk of easing prematurely.”
“We cannot pre-commit to any particular rate path due to very high uncertainty.”
“It's virtually impossible to quantify a change in the natural rate of interest in real-time with any reasonable degree of precision.”
“The closer we get to a potentially neutral level, and this could be well above 2%, we need to move even more cautiously.”
“2% target has served us well, a change in the target is not appropriate.”
“Geopolitical shocks are a key risk that we need to watch, and this poses upside risks to the inflation outlook.”
“Over the longer run, geopolitical fragmentation would pose further upside risks to inflation by reducing the efficiency and reliability of global supply chains.”
These comments have little to no market reaction to the Euro. The EUR/USD pair is trading at 1.0861, losing 0.06% on the day.
The European Central Bank (ECB) in Frankfurt, Germany, is the reserve bank for the Eurozone. The ECB sets interest rates and manages monetary policy for the region. The ECB primary mandate is to maintain price stability, which means keeping inflation at around 2%. Its primary tool for achieving this is by raising or lowering interest rates. Relatively high interest rates will usually result in a stronger Euro and vice versa. The ECB Governing Council makes monetary policy decisions at meetings held eight times a year. Decisions are made by heads of the Eurozone national banks and six permanent members, including the President of the ECB, Christine Lagarde.
In extreme situations, the European Central Bank can enact a policy tool called Quantitative Easing. QE is the process by which the ECB prints Euros and uses them to buy assets – usually government or corporate bonds – from banks and other financial institutions. QE usually results in a weaker Euro. QE is a last resort when simply lowering interest rates is unlikely to achieve the objective of price stability. The ECB used it during the Great Financial Crisis in 2009-11, in 2015 when inflation remained stubbornly low, as well as during the covid pandemic.
Quantitative tightening (QT) is the reverse of QE. It is undertaken after QE when an economic recovery is underway and inflation starts rising. Whilst in QE the European Central Bank (ECB) purchases government and corporate bonds from financial institutions to provide them with liquidity, in QT the ECB stops buying more bonds, and stops reinvesting the principal maturing on the bonds it already holds. It is usually positive (or bullish) for the Euro.
The Australian Dollar (AUD) continues to experience a decline for the second consecutive session, largely influenced by recent mixed economic data from China released on Friday. The Aussie Dollar had already been under pressure after Australia's employment figures released on Thursday presented a mixed picture. Any economic change in the Chinese economy could catalyze the Australian market as both nations are close trade partners.
The Australian Dollar’s decline is bolstered as the yield on Australia’s 10-year government bond has dropped to near 4.2%, marking its lowest level in a month. This decline in bond yields is a reaction to the domestic jobs report, which showed an unexpected slowing in wage growth during the first quarter. The slowing wage growth has led markets to discount the possibility of any interest rate hikes by the Reserve Bank of Australia (RBA).
The US Dollar Index (DXY), which gauges the performance of the US Dollar (USD) against six major currencies, has rebounded from a multi-week low of 104.08 marked on Thursday. The Federal Reserve (Fed) maintains a cautious stance regarding inflation and the potential for rate cuts in 2024. Investors will take more cues from the Minneapolis Fed President Neel Kashkari and San Francisco Fed President Mary Daly's speeches later in the day.
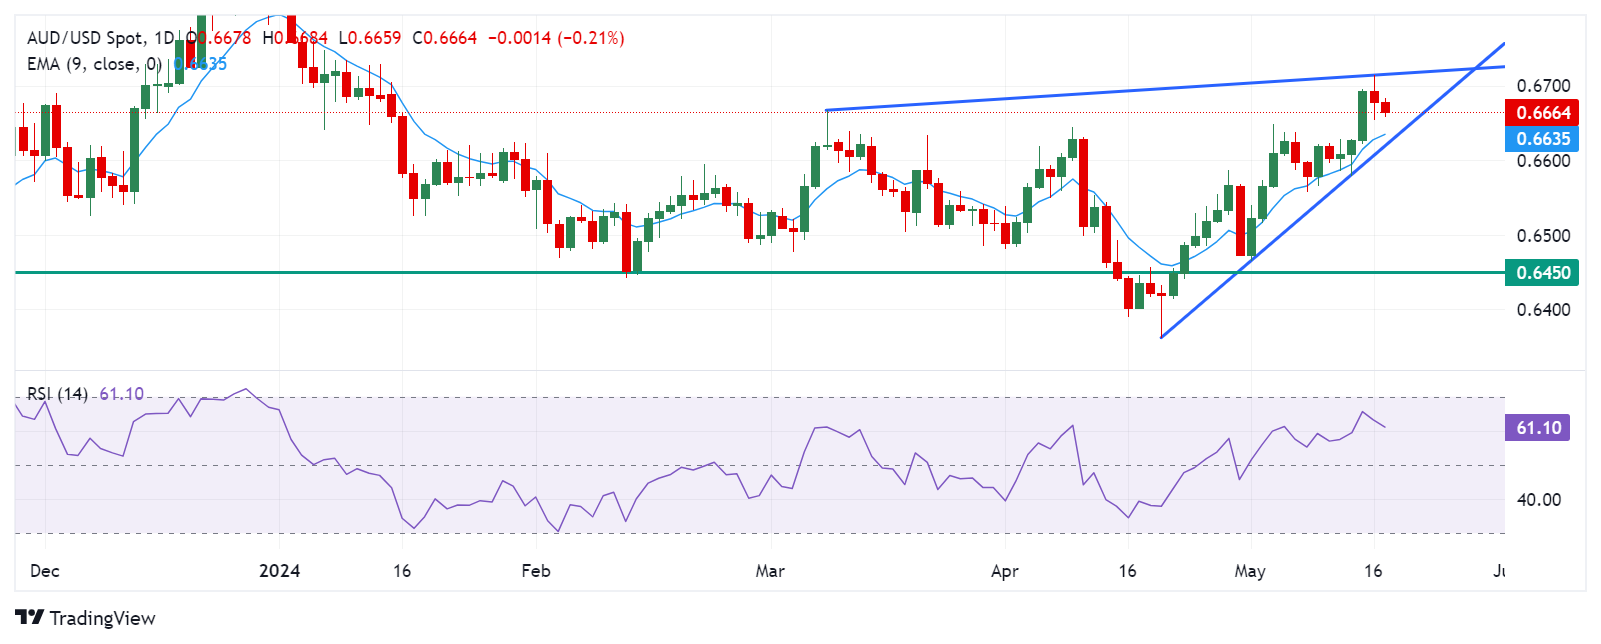
The Australian Dollar trades around 0.6660 on Friday. Observing the daily chart for AUD/USD showed an ascending triangle formation. Additionally, the 14-day Relative Strength Index (RSI) suggests a bullish sentiment, holding above the 50 mark.
The AUD/USD pair could challenge the upper threshold of the ascending triangle, resting near the four-month peak of 0.6714. A breach above this level might prompt exploration toward the significant barrier at 0.6750.
Conversely, potential support stands at the nine-day Exponential Moving Average (EMA) at 0.6634, followed by the lower boundary of the ascending triangle around at 0.6610. A breakdown below this level could exert downward pressure, directing attention toward the throwback support at 0.6550.
The table below shows the percentage change of the Australian Dollar (AUD) against listed major currencies today. The Australian Dollar was the weakest against the US Dollar.
| USD | EUR | GBP | CAD | AUD | JPY | NZD | CHF | |
| USD | 0.06% | 0.11% | 0.09% | 0.25% | 0.31% | 0.21% | 0.11% | |
| EUR | -0.08% | 0.03% | 0.02% | 0.19% | 0.24% | 0.16% | 0.05% | |
| GBP | -0.11% | -0.03% | -0.02% | 0.15% | 0.19% | 0.09% | 0.01% | |
| CAD | -0.09% | -0.02% | 0.03% | 0.17% | 0.21% | 0.13% | 0.03% | |
| AUD | -0.27% | -0.18% | -0.15% | -0.15% | 0.04% | -0.03% | -0.14% | |
| JPY | -0.30% | -0.24% | -0.19% | -0.20% | -0.05% | -0.08% | -0.19% | |
| NZD | -0.22% | -0.17% | -0.12% | -0.13% | 0.04% | 0.07% | -0.12% | |
| CHF | -0.11% | -0.04% | -0.01% | -0.03% | 0.14% | 0.18% | 0.12% |
The heat map shows percentage changes of major currencies against each other. The base currency is picked from the left column, while the quote currency is picked from the top row. For example, if you pick the Euro from the left column and move along the horizontal line to the Japanese Yen, the percentage change displayed in the box will represent EUR (base)/JPY (quote).
One of the most significant factors for the Australian Dollar (AUD) is the level of interest rates set by the Reserve Bank of Australia (RBA). Because Australia is a resource-rich country another key driver is the price of its biggest export, Iron Ore. The health of the Chinese economy, its largest trading partner, is a factor, as well as inflation in Australia, its growth rate, and Trade Balance. Market sentiment – whether investors are taking on more risky assets (risk-on) or seeking safe havens (risk-off) – is also a factor, with risk-on positive for AUD.
The Reserve Bank of Australia (RBA) influences the Australian Dollar (AUD) by setting the level of interest rates that Australian banks can lend to each other. This influences the level of interest rates in the economy as a whole. The main goal of the RBA is to maintain a stable inflation rate of 2-3% by adjusting interest rates up or down. Relatively high interest rates compared to other major central banks support the AUD, and the opposite for relatively low. The RBA can also use quantitative easing and tightening to influence credit conditions, with the former AUD-negative and the latter AUD-positive.
China is Australia’s largest trading partner so the health of the Chinese economy is a major influence on the value of the Australian Dollar (AUD). When the Chinese economy is doing well it purchases more raw materials, goods and services from Australia, lifting demand for the AUD, and pushing up its value. The opposite is the case when the Chinese economy is not growing as fast as expected. Positive or negative surprises in Chinese growth data, therefore, often have a direct impact on the Australian Dollar and its pairs.
Iron Ore is Australia’s largest export, accounting for $118 billion a year according to data from 2021, with China as its primary destination. The price of Iron Ore, therefore, can be a driver of the Australian Dollar. Generally, if the price of Iron Ore rises, AUD also goes up, as aggregate demand for the currency increases. The opposite is the case if the price of Iron Ore falls. Higher Iron Ore prices also tend to result in a greater likelihood of a positive Trade Balance for Australia, which is also positive of the AUD.
The Trade Balance, which is the difference between what a country earns from its exports versus what it pays for its imports, is another factor that can influence the value of the Australian Dollar. If Australia produces highly sought after exports, then its currency will gain in value purely from the surplus demand created from foreign buyers seeking to purchase its exports versus what it spends to purchase imports. Therefore, a positive net Trade Balance strengthens the AUD, with the opposite effect if the Trade Balance is negative.
China’s Retail Sales rose 2.3% YoY in April from 3.1% in March, worse than the 3.8% expected. The nation’s Industrial Production improved 6.7% YoY in the same period versus 5.5% anticipated and 4.5% recorded previously. The official data was published by the National Bureau of Statistics (NBS) on Friday.
Meanwhile, the Fixed Asset Investment rose 4.2% YTD YoY in April versus the 4.6% expected and 4.5% seen in March.
The Australian Dollar (AUD) attracts some sellers following the Chinese data. The AUD/USD pair is adding 0.16% on the day to trade at 0.6666, as of writing.
One of the most significant factors for the Australian Dollar (AUD) is the level of interest rates set by the Reserve Bank of Australia (RBA). Because Australia is a resource-rich country another key driver is the price of its biggest export, Iron Ore. The health of the Chinese economy, its largest trading partner, is a factor, as well as inflation in Australia, its growth rate and Trade Balance. Market sentiment – whether investors are taking on more risky assets (risk-on) or seeking safe-havens (risk-off) – is also a factor, with risk-on positive for AUD.
The Reserve Bank of Australia (RBA) influences the Australian Dollar (AUD) by setting the level of interest rates that Australian banks can lend to each other. This influences the level of interest rates in the economy as a whole. The main goal of the RBA is to maintain a stable inflation rate of 2-3% by adjusting interest rates up or down. Relatively high interest rates compared to other major central banks support the AUD, and the opposite for relatively low. The RBA can also use quantitative easing and tightening to influence credit conditions, with the former AUD-negative and the latter AUD-positive.
China is Australia’s largest trading partner so the health of the Chinese economy is a major influence on the value of the Australian Dollar (AUD). When the Chinese economy is doing well it purchases more raw materials, goods and services from Australia, lifting demand for the AUD, and pushing up its value. The opposite is the case when the Chinese economy is not growing as fast as expected. Positive or negative surprises in Chinese growth data, therefore, often have a direct impact on the Australian Dollar and its pairs.
Iron Ore is Australia’s largest export, accounting for $118 billion a year according to data from 2021, with China as its primary destination. The price of Iron Ore, therefore, can be a driver of the Australian Dollar. Generally, if the price of Iron Ore rises, AUD also goes up, as aggregate demand for the currency increases. The opposite is the case if the price of Iron Ore falls. Higher Iron Ore prices also tend to result in a greater likelihood of a positive Trade Balance for Australia, which is also positive of the AUD.
The Trade Balance, which is the difference between what a country earns from its exports versus what it pays for its imports, is another factor that can influence the value of the Australian Dollar. If Australia produces highly sought after exports, then its currency will gain in value purely from the surplus demand created from foreign buyers seeking to purchase its exports versus what it spends to purchase imports. Therefore, a positive net Trade Balance strengthens the AUD, with the opposite effect if the Trade Balance is negative.
The NZD/USD pair extended its losses to near 0.6110 during the Asian session on Friday. This decline can be attributed to the recovery of the US Dollar (USD), which rebounded after hitting multi-week lows around 104.00 on Thursday.
The Federal Reserve (Fed) maintains a cautious stance regarding inflation and the potential for rate cuts in 2024. On Thursday, Fed Bank of Atlanta President Raphael Bostic emphasized the need for patience with interest rates, noting that substantial pricing pressure persists in the US economy.
Additionally, Cleveland Fed President Loretta Mester indicated that it might take longer than anticipated to confidently ascertain the inflation trajectory, suggesting that the Fed should maintain its restrictive stance for an extended period.
Furthermore, the US Department of Labor released the US Initial Jobless Claims on Thursday. The number of Americans filing new claims for jobless benefits rose to 222,000 for the week ending May 10, surpassing the market consensus of 220,000 but below the previous week's figure of 232,000.
On the Kiwi front, New Zealand's Producer Price Index (PPI) inputs and outputs increased in the first quarter. PPI input prices rose by 0.7% compared to the expected 0.7%. While PPI output prices increased by 0.9% against the expected 0.5%. These higher-than-expected PPI figures could provide some support for the New Zealand Dollar (NZD), potentially limiting the downside of the NZD/USD pair.
According to Stats NZ, the largest contributors to the rise in output prices were electricity and gas, which saw an 8.8% quarter-on-quarter increase. Energy costs also significantly impacted input prices, climbing 11.6%. Additionally, insurance costs substantially contributed to the increase in PPI input costs, rising by 5.0% quarter-on-quarter.
| Overview | |
|---|---|
| Today last price | 0.6113 |
| Today Daily Change | -0.0008 |
| Today Daily Change % | -0.13 |
| Today daily open | 0.6121 |
| Trends | |
|---|---|
| Daily SMA20 | 0.5985 |
| Daily SMA50 | 0.6008 |
| Daily SMA100 | 0.6079 |
| Daily SMA200 | 0.6039 |
| Levels | |
|---|---|
| Previous Daily High | 0.6141 |
| Previous Daily Low | 0.6095 |
| Previous Weekly High | 0.6041 |
| Previous Weekly Low | 0.598 |
| Previous Monthly High | 0.6079 |
| Previous Monthly Low | 0.5851 |
| Daily Fibonacci 38.2% | 0.6113 |
| Daily Fibonacci 61.8% | 0.6123 |
| Daily Pivot Point S1 | 0.6097 |
| Daily Pivot Point S2 | 0.6073 |
| Daily Pivot Point S3 | 0.6051 |
| Daily Pivot Point R1 | 0.6143 |
| Daily Pivot Point R2 | 0.6165 |
| Daily Pivot Point R3 | 0.6189 |
The People’s Bank of China (PBoC) set the USD/CNY central rate for the trading session ahead on Friday at 7.1045 as compared to the previous day's fix of 7.1020 and 7.2222 Reuters estimates.
The USD/CAD pair trades on a stronger note around 1.3620 on Friday during the early Asian trading hours. The uptick of the pair is bolstered by the renewed US Dollar (USD) demand as the US Federal Reserve (Fed) officials emphasized their cautious stance to hold rates higher for longer.
On Thursday, the US weekly Initial Jobless Claims for the week ending May 11 came in at 222,000 from the previous week of 232,000, above the market consensus of 220,000, according to the US Bureau of Labor Statistics (BLS). Housing Starts climbed 5.7% MoM to 1.36 million in April, while Building Permits declined by 3% MoM in April to 1.44 million. However, these mixed reports had little to no impact on the Greenback as traders kept an eye on the Fed official's remarks about the interest rate cuts.
Atlanta Fed President Raphael Bostic stated on Thursday that he saw signs of cooling inflation in the recent report, but he prefers to watch the May and June data to make sure the inflation doesn’t turn back the other way. Meanwhile, Cleveland Fed President Loretta Mester said she wants to see more data to gain confidence that inflation is on course to meet the Fed’s 2% target.
Richmond Fed President Tom Barkin noted the central bank needs to keep borrowing costs high for longer to ensure inflation is on track to its target, citing higher prices in the services sector. Financial markets are currently pricing in nearly 70% odds of a Fed rate cut in September, an increase from 65% earlier in the week, according to the CME FedWatch Tool.
On the Loonie front, Canada’s Manufacturing Sales fell 2.1% MoM in March from a 0.9% rise in February, weaker than the market expectation of a decline of 1.4%, Statistics Canada showed Wednesday. Elsewhere, the extended rebound in oil prices might lift the commodity-linked Canadian Dollar (CAD) and cap the upside of the pair as Canada is the largest oil exporter to the United States.
| Overview | |
|---|---|
| Today last price | 1.3624 |
| Today Daily Change | 0.0006 |
| Today Daily Change % | 0.04 |
| Today daily open | 1.3618 |
| Trends | |
|---|---|
| Daily SMA20 | 1.3684 |
| Daily SMA50 | 1.363 |
| Daily SMA100 | 1.3545 |
| Daily SMA200 | 1.3568 |
| Levels | |
|---|---|
| Previous Daily High | 1.3641 |
| Previous Daily Low | 1.359 |
| Previous Weekly High | 1.3763 |
| Previous Weekly Low | 1.3618 |
| Previous Monthly High | 1.3846 |
| Previous Monthly Low | 1.3478 |
| Daily Fibonacci 38.2% | 1.3622 |
| Daily Fibonacci 61.8% | 1.361 |
| Daily Pivot Point S1 | 1.3592 |
| Daily Pivot Point S2 | 1.3565 |
| Daily Pivot Point S3 | 1.354 |
| Daily Pivot Point R1 | 1.3643 |
| Daily Pivot Point R2 | 1.3667 |
| Daily Pivot Point R3 | 1.3694 |
Western Texas Intermediate (WTI), the US crude oil benchmark, is trading around $78.90 on Friday. The black gold edges higher amid the recent drop in US crude inventories and the possible interest rate cuts by the Federal Reserve (Fed).
The recent US CPI inflation report this week showed that US inflation eased slightly in April, prompting the expectation of interest rate cuts from the US Fed in September. This, in turn, weighs on the US Dollar (USD) and benefits USD-denominated oil as lower interest rates help stimulate the economy, which can boost crude oil demand.
About the data, a decline in oil inventories lifted the black gold. Crude inventories in the US for the week ending May 3 fell by 2.5 million barrels to 457 million barrels, from 1.36 million barrels drawn in the previous week, according to the Energy Information Administration (EIA). The market consensus projected that stocks would decrease by 1.35 million barrels.
On Thursday, Israel's tanks moved into Jabalia in northern Gaza and pummelling Rafah in the south without advancing, per Reuters. Ceasefire negotiations mediated by Qatar and Egypt are at a stalemate, with Hamas demanding a stop to attacks and Israel refusing until the group is annihilated. Oil traders will closely monitor the developments surrounding the renewed geopolitical tensions in the Middle East. Any escalating geopolitical risks might raise concern about oil supply disruptions, lifting the WTI prices.
| Overview | |
|---|---|
| Today last price | 78.98 |
| Today Daily Change | 0.10 |
| Today Daily Change % | 0.13 |
| Today daily open | 78.88 |
| Trends | |
|---|---|
| Daily SMA20 | 80.14 |
| Daily SMA50 | 81.52 |
| Daily SMA100 | 78.36 |
| Daily SMA200 | 79.67 |
| Levels | |
|---|---|
| Previous Daily High | 79.3 |
| Previous Daily Low | 77.75 |
| Previous Weekly High | 79.56 |
| Previous Weekly Low | 76.71 |
| Previous Monthly High | 87.12 |
| Previous Monthly Low | 80.62 |
| Daily Fibonacci 38.2% | 78.71 |
| Daily Fibonacci 61.8% | 78.34 |
| Daily Pivot Point S1 | 77.98 |
| Daily Pivot Point S2 | 77.09 |
| Daily Pivot Point S3 | 76.44 |
| Daily Pivot Point R1 | 79.53 |
| Daily Pivot Point R2 | 80.19 |
| Daily Pivot Point R3 | 81.08 |
EUR/USD eased slightly on Thursday, falling back below 1.0880 as the Greenback broadly recovers losses from earlier in the week. The pair remains notably up for the trading week, but a late break for the US Dollar is on the cards as investors second-guess the Fed Reserve’s (Fed) stance on rate cuts and keep one foot in the safe haven USD.
A June rate cut from the European Central Bank (ECB) is getting priced in by traders. ECB policymakers have been prodding markets cautiously in recent appearances, but ECB Governing Council member and Governor of the Latvian central bank Martins Kazaks announced Thursday that a June rate cut is definitely on the table. Markets will be keeping a close eye on next week’s Purchasing Manager’s Index (PMI) figures that are due from both the EU and the US.
Read more: Fed officials stick to cautious tones
Fed officials continue to dominate investor focus, with multiple policymaker from the US central bank giving soundbites on Thursday. Fed officials have broadly struck a notably cautious tone as the Fed tries to keep market hopes for Fed rate cuts to a dull simmer. At current cut, the CME’s FedWatch Tool shows rate markets are pricing in 70% odds of at least a quarter-point cut from the Fed in September, with 90% odds of two total rate cuts by the end of year.
Several central bankers are expected to make appearances on Friday, with a speech from the ECB’s Luis de Guindos, and the Fed’s Neel Kashkari, Christopher Waller, and Mary Daly on the docket to round out the trading week.
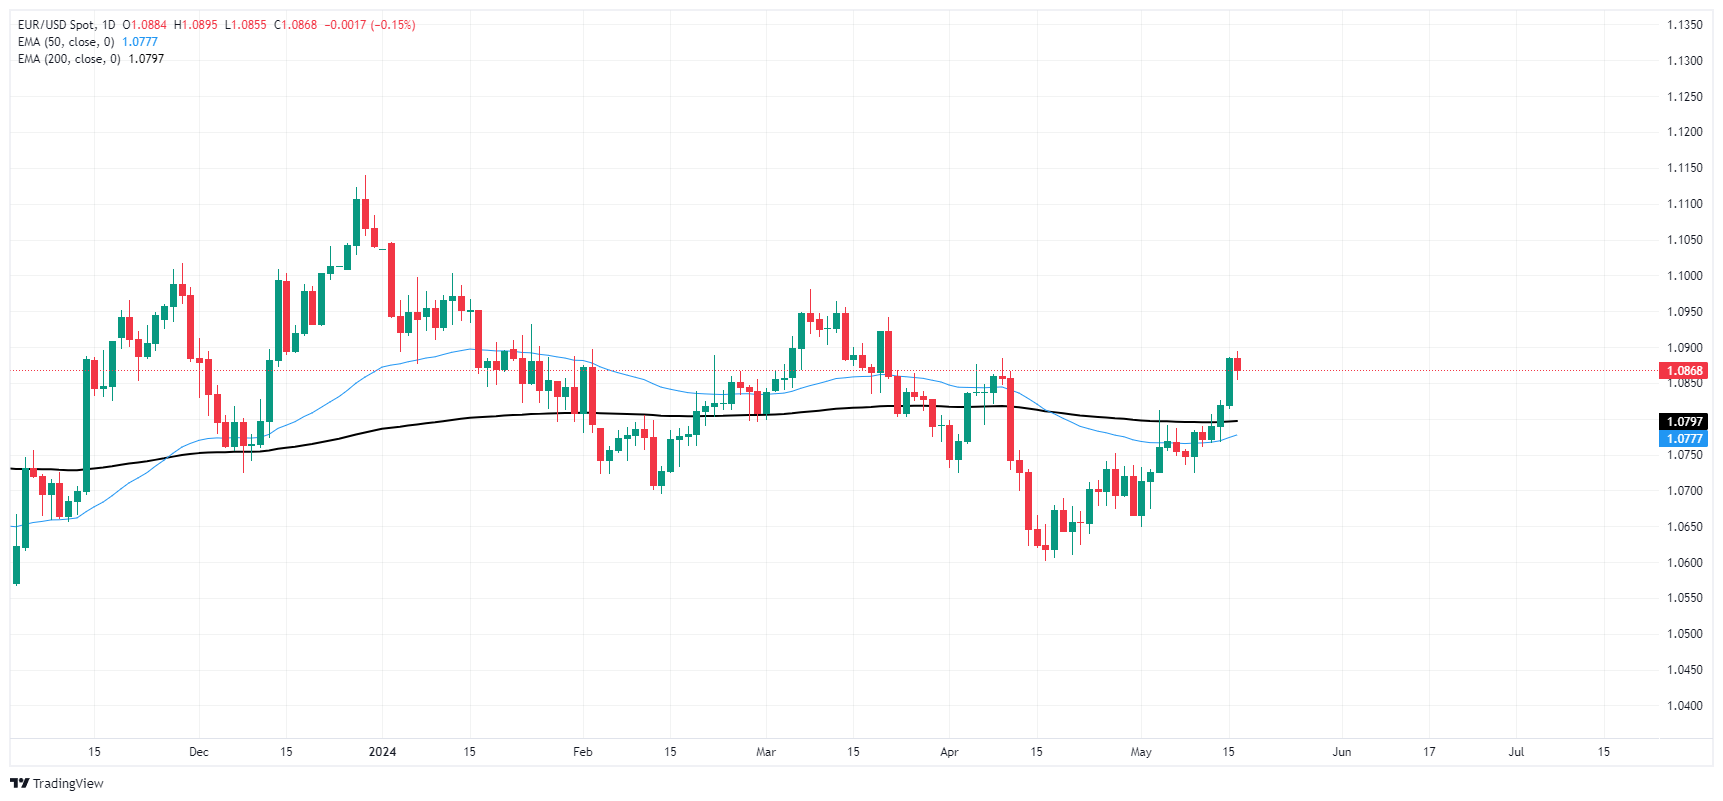
EUR/USD trimmed away some gains, briefly falling back below 1.0860 on Thursday, but the pair remains notably bullish in the near-term, trading well above the 200-hour Exponential Moving Average (EMA) at 1.0802. The pair is testing into its highest bids since mid-March, and is on pace to close in the green for a fourth consecutive week.
Bullish momentum has carried EUR/USD back above the 200-day EMA at 1.0799, and the pair is up 2.5% from the last swing low into the 1.0600 handle. A technical ceiling is priced in at the March swing high of 1.0980, and bulls will have their work cut out for them if a push back to the 1.1000 handle is to be achieved.

| Overview | |
|---|---|
| Today last price | 1.0868 |
| Today Daily Change | -0.0016 |
| Today Daily Change % | -0.15 |
| Today daily open | 1.0884 |
| Trends | |
|---|---|
| Daily SMA20 | 1.0734 |
| Daily SMA50 | 1.0786 |
| Daily SMA100 | 1.0823 |
| Daily SMA200 | 1.079 |
| Levels | |
|---|---|
| Previous Daily High | 1.0886 |
| Previous Daily Low | 1.0813 |
| Previous Weekly High | 1.0791 |
| Previous Weekly Low | 1.0724 |
| Previous Monthly High | 1.0885 |
| Previous Monthly Low | 1.0601 |
| Daily Fibonacci 38.2% | 1.0858 |
| Daily Fibonacci 61.8% | 1.0841 |
| Daily Pivot Point S1 | 1.0836 |
| Daily Pivot Point S2 | 1.0788 |
| Daily Pivot Point S3 | 1.0764 |
| Daily Pivot Point R1 | 1.0909 |
| Daily Pivot Point R2 | 1.0934 |
| Daily Pivot Point R3 | 1.0982 |
The GBP/USD pair posts modest gains near 1.2670 during the early Asian session on Friday. Meanwhile, the USD Index (DXY) recovers some lost ground after retracing to multi-week lows near 104.00 in the previous session. The Federal Reserve (Fed) sticks to cautious tones regarding inflation and the chance of rate cuts this year. Investors will take more cues from the Fed’s Kashkari, Waller, and Daly speeches later in the day.
Several Fed officials emphasized the need to keep borrowing costs high for longer as they await more evidence that inflation is easing. On Thursday, Fed Bank of Atlanta President Raphael Bostic cautioned about the need for patience with interest rates, saying that there is still a lot of pricing pressure in the US economy. Cleveland Fed President Loretta Mester stated that it might take longer than expected to gain confidence about the path of inflation, adding that the Fed should hold its restrictive stance for longer. The cautious approach from the Fed policymakers has provided some support to the Greenback and weighs on the major pair.
The number of Americans filing new claims for jobless benefits rose by 222K for the week ending May 11, the US Department of Labor (DoL) reported Thursday. The figure came in above the market consensus of 220K and below the previous reading of 232K gains.
On the GBP’s front, the Bank of England (BoE) noted last week that the UK central bank needs to see more evidence that inflation will stay low, but he thought the inflation is moving in the right direction and a June cut cannot be ruled out. The BoE policymaker Megan Greene said the BoE wants more data on price pressures easing before it starts easing policy. The expectation that the UK central bank might cut the interest rate before the US Fed is likely to weigh on the Pound Sterling (GBP) and cap the upside of the GBP/USD pair in the near term.
| Overview | |
|---|---|
| Today last price | 1.2671 |
| Today Daily Change | -0.0015 |
| Today Daily Change % | -0.12 |
| Today daily open | 1.2686 |
| Trends | |
|---|---|
| Daily SMA20 | 1.251 |
| Daily SMA50 | 1.2593 |
| Daily SMA100 | 1.2633 |
| Daily SMA200 | 1.2541 |
| Levels | |
|---|---|
| Previous Daily High | 1.2687 |
| Previous Daily Low | 1.2584 |
| Previous Weekly High | 1.2594 |
| Previous Weekly Low | 1.2446 |
| Previous Monthly High | 1.2709 |
| Previous Monthly Low | 1.23 |
| Daily Fibonacci 38.2% | 1.2647 |
| Daily Fibonacci 61.8% | 1.2623 |
| Daily Pivot Point S1 | 1.2617 |
| Daily Pivot Point S2 | 1.2549 |
| Daily Pivot Point S3 | 1.2514 |
| Daily Pivot Point R1 | 1.272 |
| Daily Pivot Point R2 | 1.2755 |
| Daily Pivot Point R3 | 1.2823 |
New Zealand's Producer Price Index (PPI) inputs and outputs rose in the first quarter, with business input prices rising 0.7% (previous 0.9%), and business output prices rising 0.9% (previous 0.7%).
According to Stats NZ, the largest contributor to output prices were electricity and gas, which rose 8.8% QoQ, with energies also making up the largest contributor to input prices, which climbed 11.6%. Insurance costs also contributed heavily to PPI input cost increases, rising 5.0% QoQ.
As markets head into the Pacific Friday market session, NZD/USD is trading on the high side. The pair is testing above 0.6120 after setting a Thursday peak above 0.6145.
The Producer Price Index Out released by the Statistics New Zealand is a measurement of the price changes of goods produced by the producers in New Zealand. Generally speaking, a price hike generates higher retail prices for consumers. Thus, a high reading is seen as positive (or bullish) for the NZD, while a low reading is seen as negative (or bearish).
The Australian Dollar posted losses of 0.23% against the US Dollar on Thursday amid higher US yields that underpinned the Greenback during the day. Wall Street hit new all-time highs but retreated afterward, ending the session with losses. As Friday’s Asian session begins, the AUD/USD trades at 0.6678, virtually unchanged.
Traders’ sentiment remains upbeat, as speculations that the Federal Reserve would join the list of central banks that might ease policy grew. The latest US consumer inflation report on Wednesday increased the odds that the Fed might cut at least 41 basis points toward the end of 2024.
On Thursday, Initial Jobless Claims for the last week increased by 222K, above estimates, but trailed the prior week’s 232K. Other data showed that housing data was mixed, with Housing Starts increasing 5.7% YoY, while Building Permits plunged -3%.
Elsewhere, the Fed revealed that Industrial Production stalled in April, coming to 0% MoM, below estimates and the prior month’s 0.1% increase.
Meanwhile, a slew of Fed officials hit the wires on Thursday, saying the central bank should keep rates higher for longer as they wait for more evidence that inflation is slowing. The Fed Regional Bank Presidents Loretta Mester, John Williams, and Thomas Barkin argued that curb inflation to their 2% goal may take longer than expected.
On the Aussies' front, the latest jobs report revealed the economy added 38.5K jobs in April, but the unemployment rate was revised from 3.9% to 4.1%. Most of the jobs added were part-time, with figures rising 44.6K, offsetting the losses of full-time employment of -6.1 K.
ANZ analysts said, “The weakness in hours worked and the moderation in yearly wage growth reported in the Wage Price Index together confirm a picture of a softening labour market. There is no change to our RBA view off the back of these data.”
Ahead of the week, the Australian docket is empty, while the US one will feature further Fed speaking, led by Governor Christopher Waller.
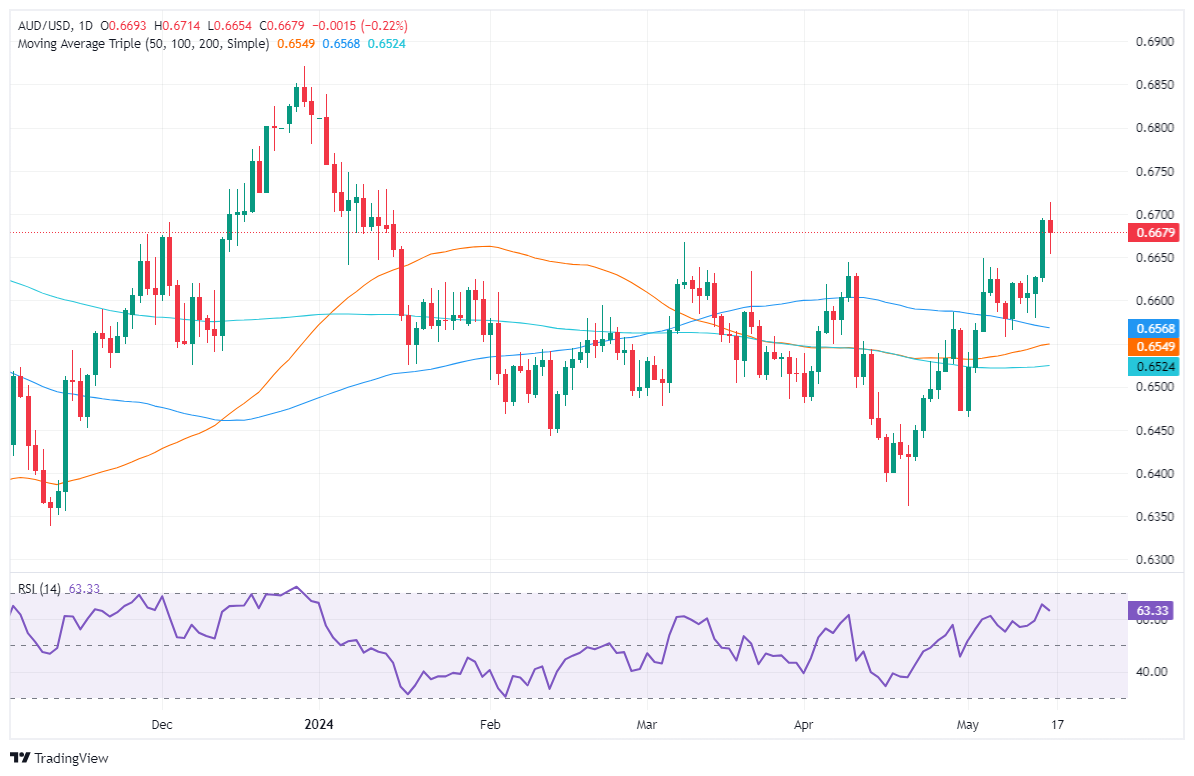
The AUD/USD uptrend remains in place, though it paused after breaching the 0.6700 figure. Although momentum is on the bulls’ side, as depicted by the Relative Strength Index (RSI), a drop below the Thursday low of 0.6654 could exacerbate a drop toward the May 14 low of 0.6579. On the other hand, if buyers regain 0.6700, that could pave the way to test the current week's high of 0.6714, ahead of challenging 0.6750.
The table below shows the percentage change of Australian Dollar (AUD) against listed major currencies this week. Australian Dollar was the strongest against the US Dollar.
| USD | EUR | GBP | JPY | CAD | AUD | NZD | CHF | |
|---|---|---|---|---|---|---|---|---|
| USD | -0.87% | -1.14% | -0.22% | -0.39% | -1.13% | -1.58% | -0.04% | |
| EUR | 0.87% | -0.32% | 0.64% | 0.46% | -0.29% | -0.73% | 0.83% | |
| GBP | 1.14% | 0.32% | 0.91% | 0.79% | 0.03% | -0.41% | 1.16% | |
| JPY | 0.22% | -0.64% | -0.91% | -0.20% | -0.89% | -1.43% | 0.23% | |
| CAD | 0.39% | -0.46% | -0.79% | 0.20% | -0.72% | -1.21% | 0.28% | |
| AUD | 1.13% | 0.29% | -0.03% | 0.89% | 0.72% | -0.54% | 1.13% | |
| NZD | 1.58% | 0.73% | 0.41% | 1.43% | 1.21% | 0.54% | 1.57% | |
| CHF | 0.04% | -0.83% | -1.16% | -0.23% | -0.28% | -1.13% | -1.57% |
The heat map shows percentage changes of major currencies against each other. The base currency is picked from the left column, while the quote currency is picked from the top row. For example, if you pick the Australian Dollar from the left column and move along the horizontal line to the US Dollar, the percentage change displayed in the box will represent AUD (base)/USD (quote).
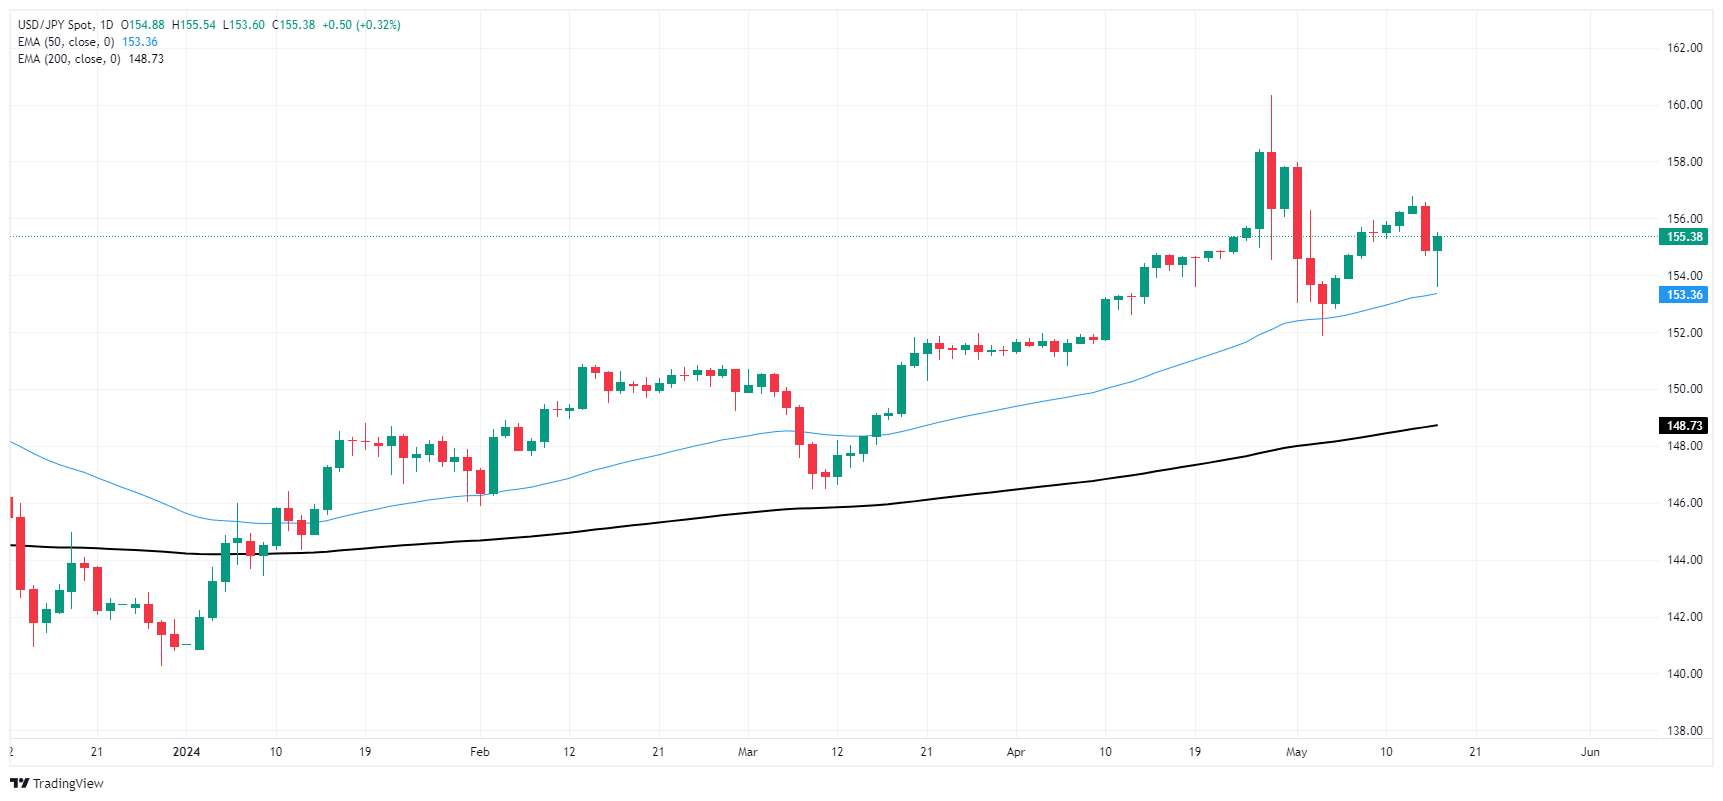
USD/JPY recovered ground on Thursday, climbing back over the 155.00 handle after dipping to 153.60 on Wednesday. Japanese growth figures contracted more than expected, and Federal Reserve (Fed) rate cut hopes are struggling beneath the weight of cautionary talking points from Fed officials.
Japan’s Gross Domestic Product (GDP) contracted more than expected in the first quarter, declining -0.5% QoQ compared to the previous quarter’s flat 0.0% print, revised down slightly from the initial print of 0.1%. Markets were expecting a -0.4% contraction. Annualized Japanese GDP growth also contracted, decline -2.0% for the year ended Q1, worse than the expected -1.5% and down from the previous 0.0% (also revised down from 0.4%).
Read more: Fed officials stick to cautious tones, but outlook beginning to tease rate cuts
Fed officials have begrudgingly begun to hint at the possibility of late-year rate cuts in 2024, but remain overly cautious regarding the US’ inflation outlook and still-tight labor market. Inflationary pressures continue to ease, helping to bolster broad-market hopes for a Fed rate cut, but price growth still remains well above the Fed’s 2% target, and Fed policymakers are leery after disinflation progress slowed in the first quarter.
Despite risk appetite cooling slightly during the Thursday US market session, rate traders still expect the Fed to meet rate cut expectations. According to the CME’s FedWatch Tool, rate markets are pricing in 70% odds of a September rate trim of at least a quarter of a percent.
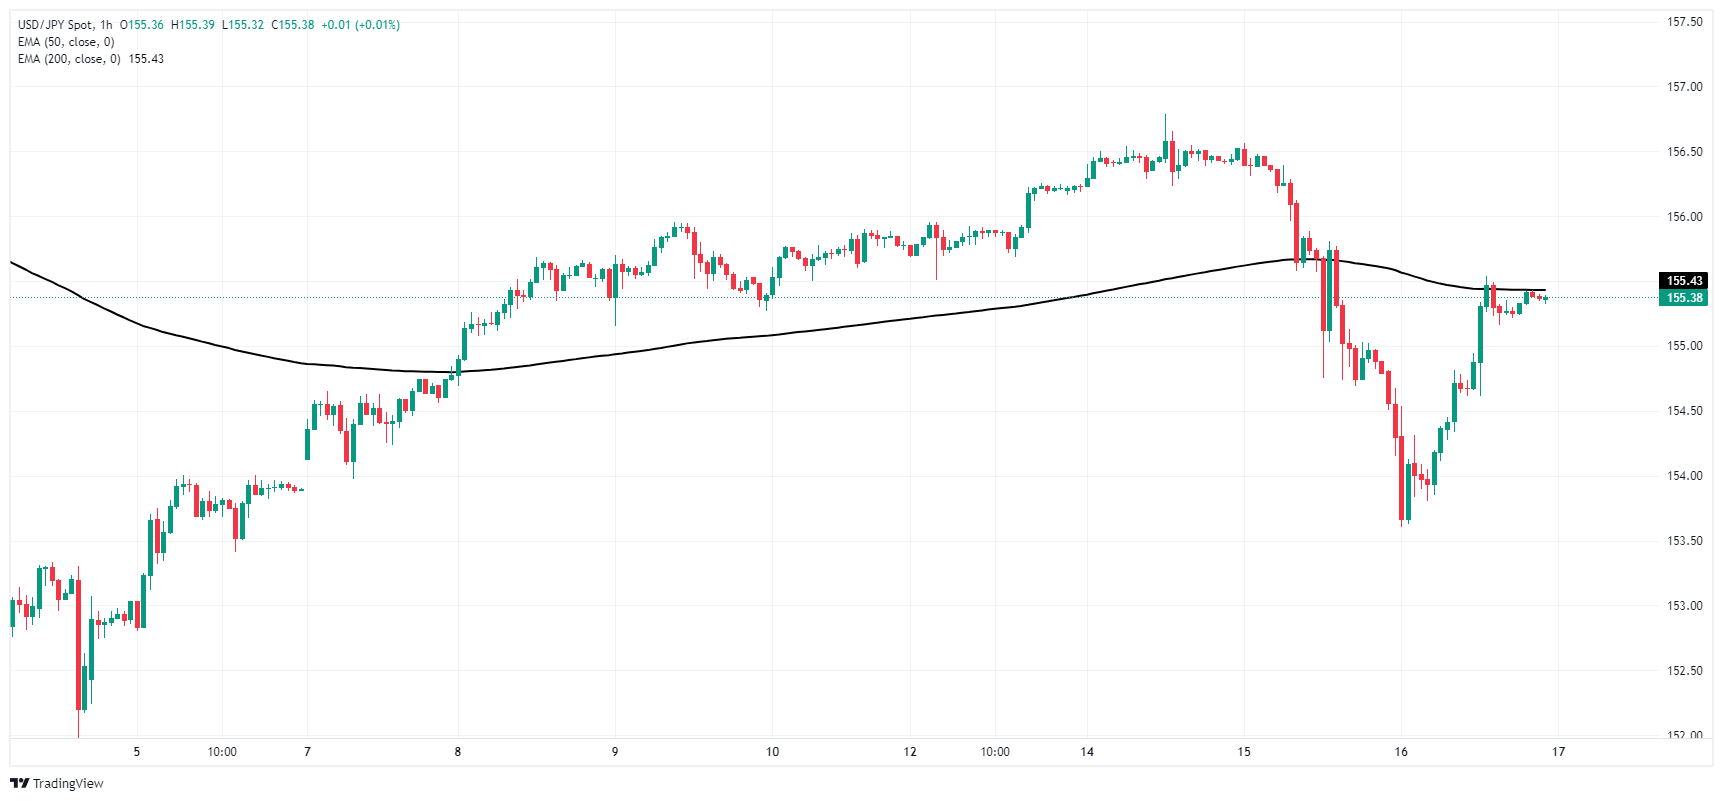
USD/JPY’s technical recovery on Thursday dragged the pair back over the 155.00 handle, but technical resistance sits nearby at the 200-hour Exponential Moving Average (EMA) at 155.44. The pair remains down from the last swing high above 156.50, but USD/JPY has recovered from the near-term low near 152.00.
USD/JPY is still trading deeply into bull country, bolstered above the 50-day EMA at 153.36 and trading well above the 200-day EMA at 148.48. Despite a suspected “Yentervention” from the Bank of Japan (BoJ) recently, the pair is still up over 10% in 2024.
| Overview | |
|---|---|
| Today last price | 155.37 |
| Today Daily Change | 0.49 |
| Today Daily Change % | 0.32 |
| Today daily open | 154.88 |
| Trends | |
|---|---|
| Daily SMA20 | 155.34 |
| Daily SMA50 | 152.75 |
| Daily SMA100 | 150.22 |
| Daily SMA200 | 148.92 |
| Levels | |
|---|---|
| Previous Daily High | 156.56 |
| Previous Daily Low | 154.69 |
| Previous Weekly High | 155.95 |
| Previous Weekly Low | 152.8 |
| Previous Monthly High | 160.32 |
| Previous Monthly Low | 150.81 |
| Daily Fibonacci 38.2% | 155.41 |
| Daily Fibonacci 61.8% | 155.85 |
| Daily Pivot Point S1 | 154.19 |
| Daily Pivot Point S2 | 153.51 |
| Daily Pivot Point S3 | 152.32 |
| Daily Pivot Point R1 | 156.07 |
| Daily Pivot Point R2 | 157.25 |
| Daily Pivot Point R3 | 157.94 |
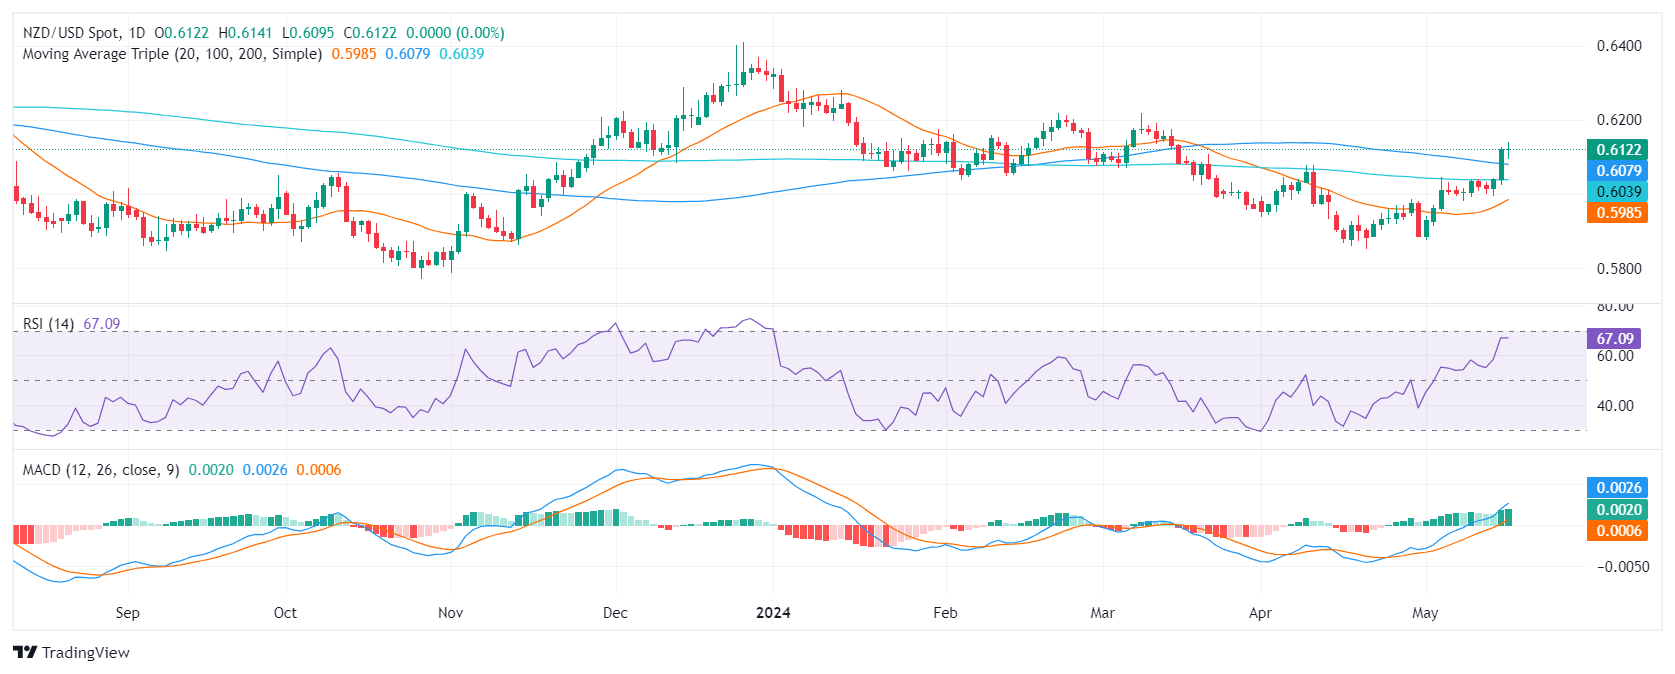
On Thursday's session, the NZD/USD remained flat at around 0.6120, as investors seem to be taking profits. After the Kiwi jumped above its main Simple Moving Averages (SMAs) the outlook turned bullish for the pair, but further consolidation may be in the horizon.
On the daily chart, the Relative Strength Index (RSI) shows positive momentum, fluctuating within positive territory, and nearing overbought status but turned flat on Thursday. The green bars of the Moving Average Convergence Divergence (MACD) reinforce the positive trend but are also flattened.
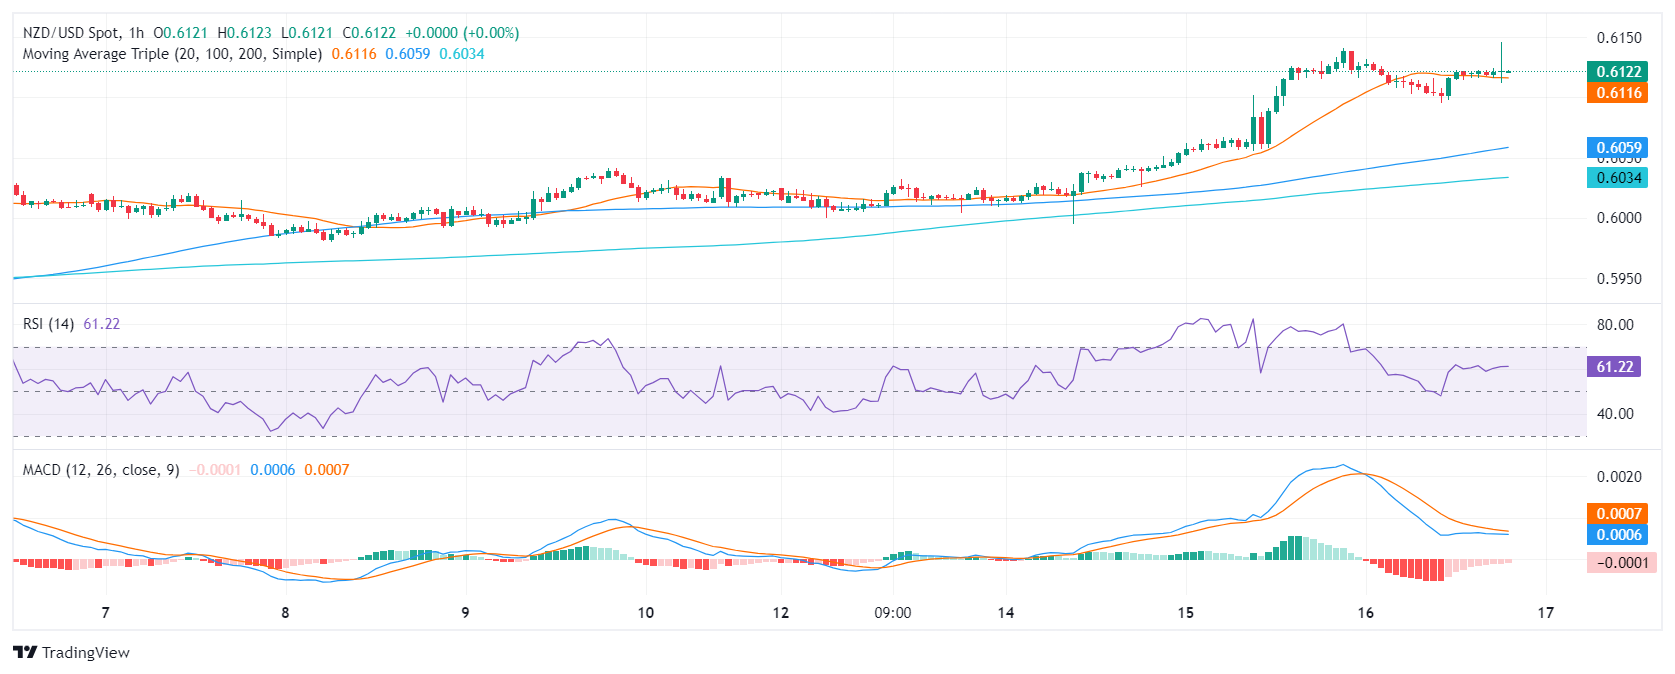
Moving to the hourly chart, mixed signals are visible. The RSI retreated slightly after being deep in overbought terrain, revealing a subtle slowdown in buying enthusiasm in recent hours. The red bars of the MACD suggest that the buying traction was weak in the last hours.
To conclude, bearing in mind the positive RSI indicators and the green MACD histogram, alongside the currency pair being above critical SMAs, the market seems to favor the bulls for the NZD/USD pair in both the short and long term but further consolidation shouldn’t be taken off the table. However, the conquered 100- and 200-day SMA will be a strong support that could limit losses.
| Overview | |
|---|---|
| Today last price | 0.6122 |
| Today Daily Change | 0.0000 |
| Today Daily Change % | 0.00 |
| Today daily open | 0.6122 |
| Trends | |
|---|---|
| Daily SMA20 | 0.5974 |
| Daily SMA50 | 0.6009 |
| Daily SMA100 | 0.6081 |
| Daily SMA200 | 0.6038 |
| Levels | |
|---|---|
| Previous Daily High | 0.6126 |
| Previous Daily Low | 0.6025 |
| Previous Weekly High | 0.6041 |
| Previous Weekly Low | 0.598 |
| Previous Monthly High | 0.6079 |
| Previous Monthly Low | 0.5851 |
| Daily Fibonacci 38.2% | 0.6088 |
| Daily Fibonacci 61.8% | 0.6064 |
| Daily Pivot Point S1 | 0.6056 |
| Daily Pivot Point S2 | 0.599 |
| Daily Pivot Point S3 | 0.5956 |
| Daily Pivot Point R1 | 0.6157 |
| Daily Pivot Point R2 | 0.6192 |
| Daily Pivot Point R3 | 0.6258 |
Nguồn dữ liệu:
Tuyên bố từ chối trách nhiệm của FX Street:Tài liệu này được FXStreet cung cấp như một phương tiện truyền thông tiếp thị chung chỉ dành cho mục đích cung cấp thông tin và không cấu thành một nghiên cứu đầu tư độc lập. Không có nội dung nào trong tài liệu này chứa hoặc nên được coi là có chứa một lời khuyên đầu tư hoặc lời chào mời nhằm mục đích mua hoặc bán bất kỳ công cụ tài chính nào. Tất cả thông tin được cung cấp đều được thu thập từ các nguồn có uy tín và bất kỳ thông tin nào chứa dấu hiệu về hiệu suất trong quá khứ không đảm bảo cho hiệu suất trong tương lai. Người dùng cần hiểu rõ rằng bất kỳ khoản đầu tư nào vào các sản phẩm FX và CFD đều có đặc điểm là có mức độ không chắc chắn nhất định và bất kỳ khoản đầu tư nào thuộc thể loại này đều có mức độ rủi ro cao mà người dùng hoàn toàn chịu trách nhiệm. Chúng tôi không chịu bất kỳ trách nhiệm nào đối với bất kỳ tổn thất nào phát sinh từ bất kỳ khoản đầu tư nào được thực hiện dựa trên thông tin được đưa ra ở đây.
Liên hệ chúng tôi |
 [email protected] [email protected] |
 +44-203 097 85 71 +44-203 097 85 71 |
 Hỗ trợ trực tuyến Hỗ trợ trực tuyến |
Giúp nhân viên của chúng tôi xác định được bạn để có thể hỗ trợ bạn tốt hơn.
Trò chuyện trực tuyến hiện không có sẵn, vui lòng thử lại sau
Chính sách Riêng tư | Tài Liệu Pháp Lý | Cookies
Khía cạnh pháp lý: HF Markets (SV) Ltd được thành lập tại St. Vincent & the Grenadines với tư cách là Công ty Kinh doanh Quốc tế, có số đăng ký 22747 IBC 2015.
Trang web được vận hành và cung cấp nội dung bởi HF Markets Group bao gồm các công ty:
Cảnh báo về rủi ro: Giao dịch các Sản phẩm sử dụng đòn bẩy như Ngoại hối và Công cụ phái sinh có thể không phù hợp với tất cả các nhà đầu tư do mức độ rủi ro cao đối với vốn của bạn. Vui lòng đảm bảo bạn hiểu rõ toàn bộ các rủi ro liên quan, cân nhắc đến mục tiêu đầu tư và mức độ kinh nghiệm của bạn trước khi giao dịch, và nếu cần, tìm lời khuyên độc lập. Để biết thêm chi tiết, xin hãy đọc toàn bộ Tiết lộ Rủi ro.
HFM không thể cung cấp dịch vụ cho các cư dân ở một số khu vực đặc biệt theo quy định pháp lý, trong đó bao gồm Hoa Kỳ, Canada, Sudan, Syria, Iran, Bắc Triều Tiên và các khu vực khác.

We have detected that you are visiting our website from the United States
Please be advised that we do not offer any of our services to U.S. citizens or residents.
You may continue navigating our website if YOU ARE NOT a U.S. citizen or resident, otherwise, you may leave this site.
 English
 العربية
 বাংলা
বাংলা 简体
简体 Deutsch
 Español
 Français
 Indonesia
 Italiano
 日本語
日本語 한국어
한국어 Melayu
 Filipino
 Português
 Pусский
 ภาษาไทย
 Việt Nam
 繁体
繁体 اردو
اردو हिंदी
हिंदी
